
Home › Research › Windows Server End of Life Dates and Statistics (2026)
Research data
Statistics on Windows Server Versions in Use, End-of-Life Dates, and What Happens Next
Windows Server end-of-life and ESU dates for every version from 2003 to 2025, how many servers still run each one, and what staying or moving costs. 2026.
Key Windows Server end-of-life statistics
- Windows Server 2016 reaches the end of extended support on 12 January 2027, 90 days after 14 October 2026.
- 20.3% of the servers an IT-inventory vendor monitors ran Windows Server 2016 in March 2026, ten months before support ends.
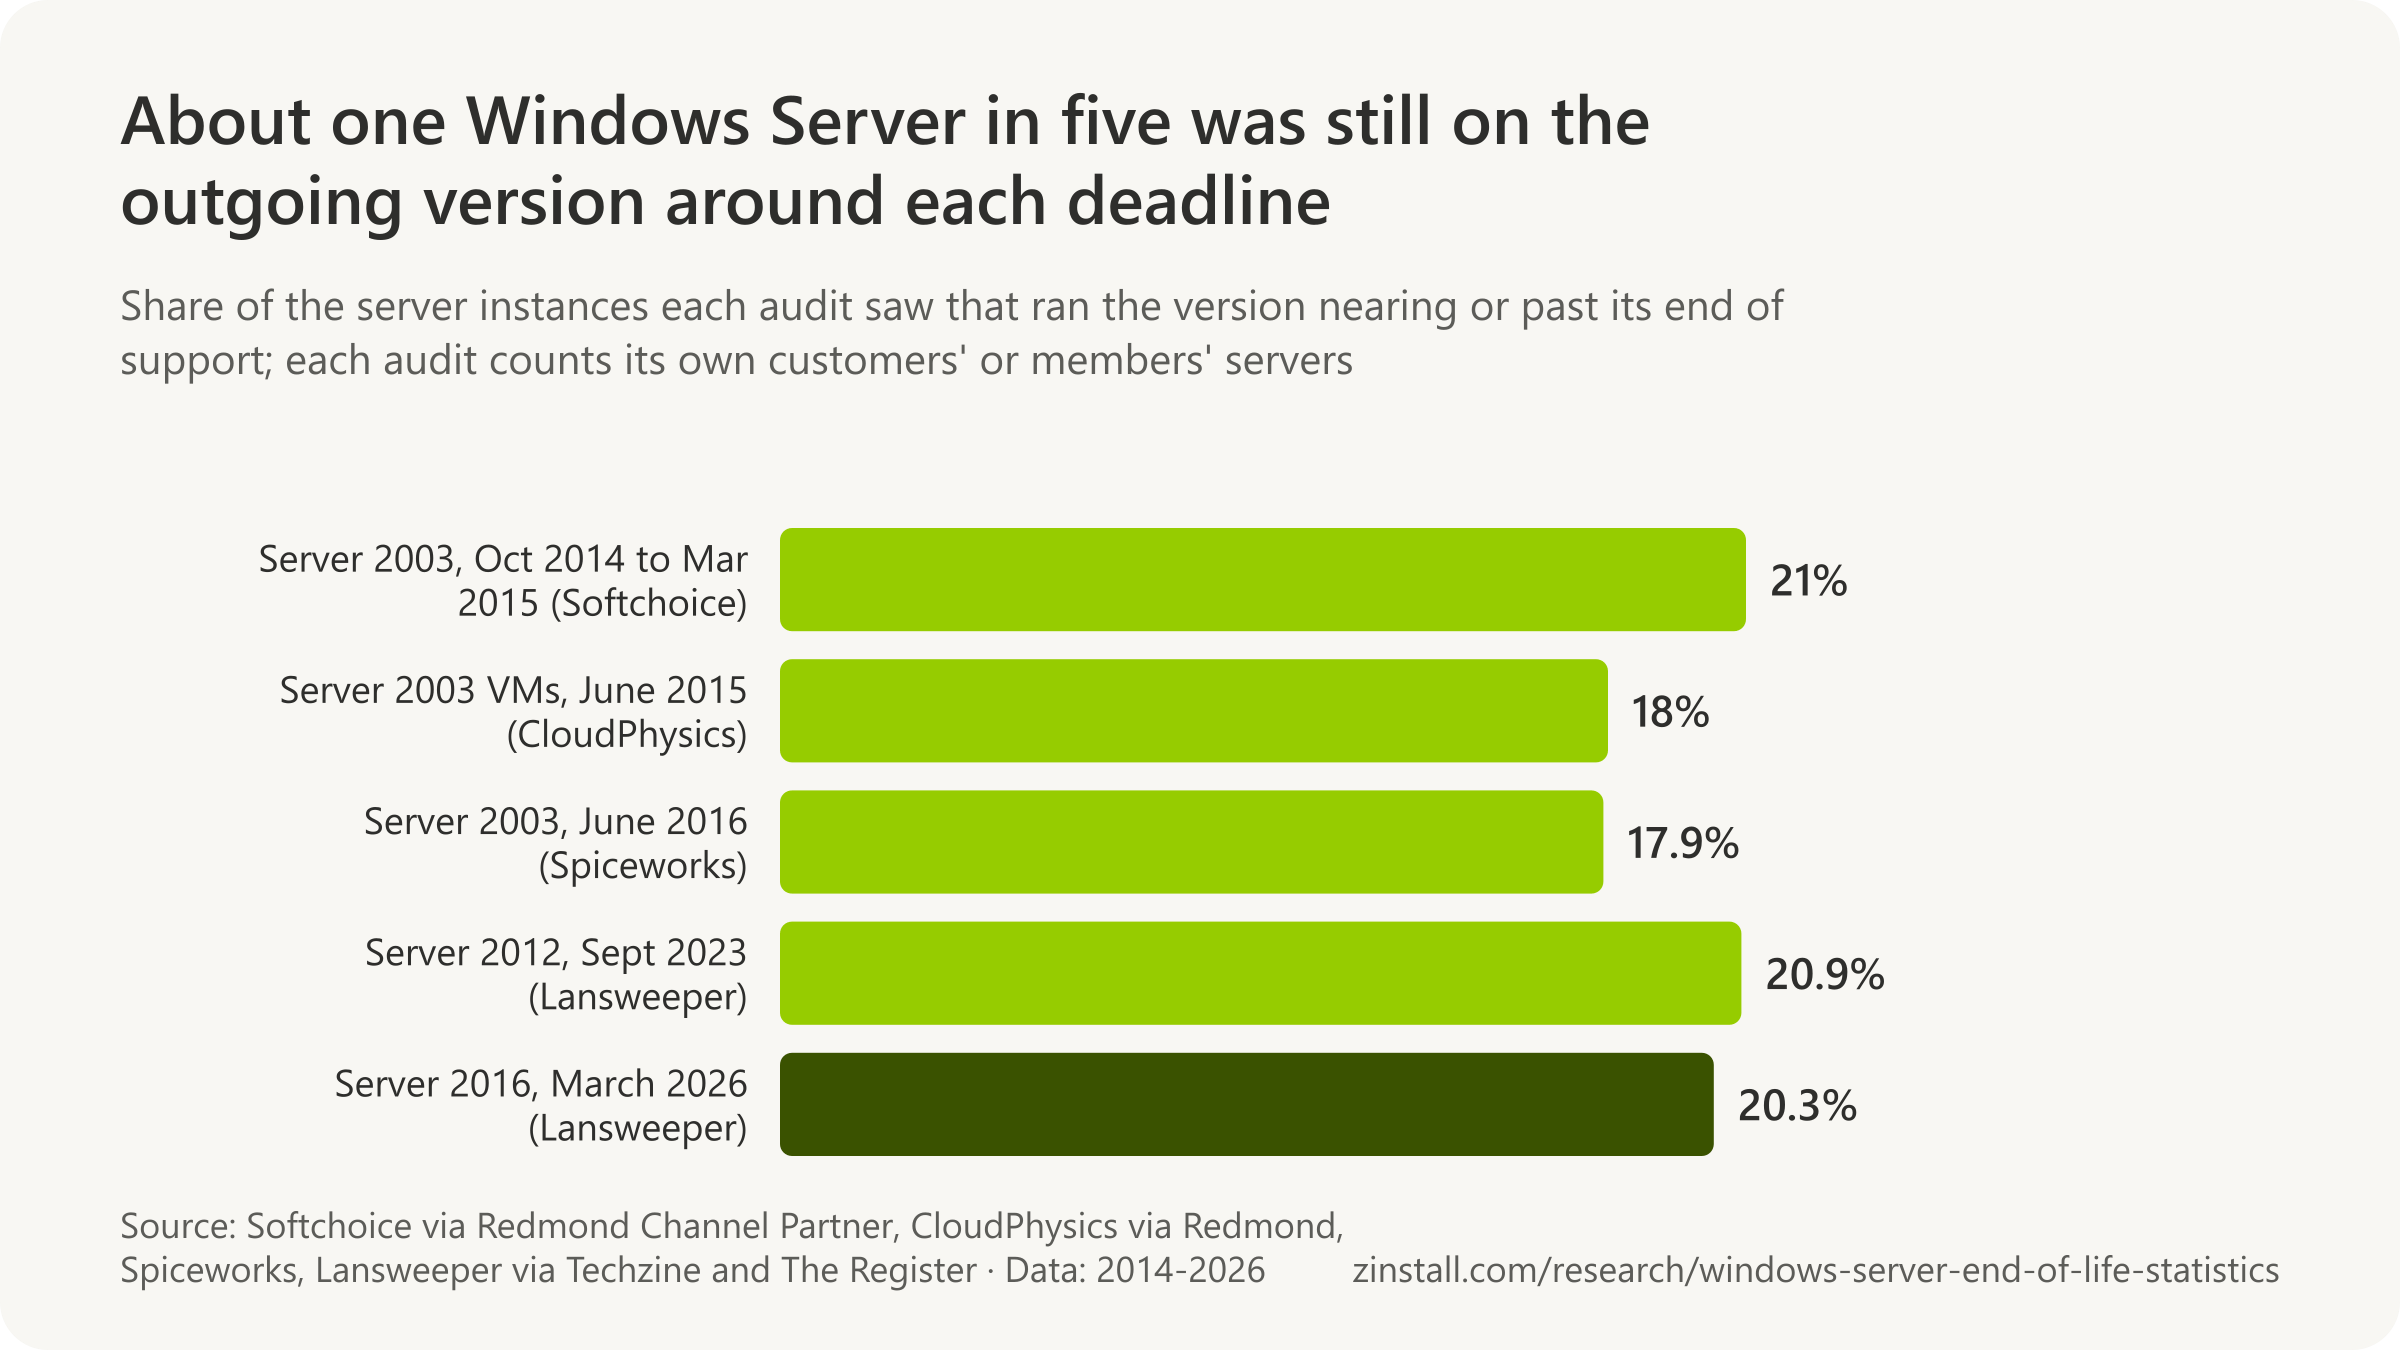
- 20.9% of 1.3 million Windows Server instances in an IT-inventory audit ran 2012 or 2012 R2 five weeks before support ended (2023).
- 49 actively exploited vulnerabilities affecting Windows Server 2012 R2 were catalogued by US authorities during its three paid update years (2026).
- Windows Server 2016 security updates cost $5.21 per core a month through Azure Arc, $2,999 over three years for 16 cores (2026).
- 53% of organisations still ran Windows Server 2003 in June 2016, 11 months after its end of support.
- 44% of enterprise workloads still ran in enterprise-owned data centres in 2026, with third-party venues at 46%.
- A server costs $22,511 a year to run in years four to six, up 199%, in a vendor-sponsored survey (2021).
Sources: Microsoft (2026, 2024); The Register; Techzine; Cybersecurity and Infrastructure Security Agency; Spiceworks; Uptime Institute; IDC
A server that still works is the hardest machine in the building to retire. It runs the line-of-business application nobody wants to reinstall, the file shares everyone depends on and the database that was migrated once, badly, in a previous decade. Microsoft's calendar does not wait: Windows Server 2012 and 2012 R2 left even paid security updates in October 2026, Windows Server 2022 left mainstream support the same day, and Windows Server 2016 reaches the end of its support in January 2027. This page collects what the calendar says, from Microsoft's own lifecycle pages, together with what the audits found still running at each deadline, what an unsupported server is exposed to, what Extended Security Updates cost, how many businesses still keep servers on their own premises, and what leaving an old server takes and costs.
Windows Server end of life dates by version
Windows Server 2016 reaches the end of extended support on 12 January 2027, 90 days after 14 October 2026 (Microsoft).

- Windows Server 2012 and 2012 R2 lost their last paid security updates on 13 October 2026.
- Windows Server 2022 left mainstream support on 13 October 2026 and gets security updates only until 14 October 2031.
- Paid Extended Security Updates for Windows Server 2016 run for up to 3 years, through 2030, and only through Azure Arc.
- 5 of 23 web pages we checked gave a different Windows Server 2016 end-of-support date from Microsoft's.
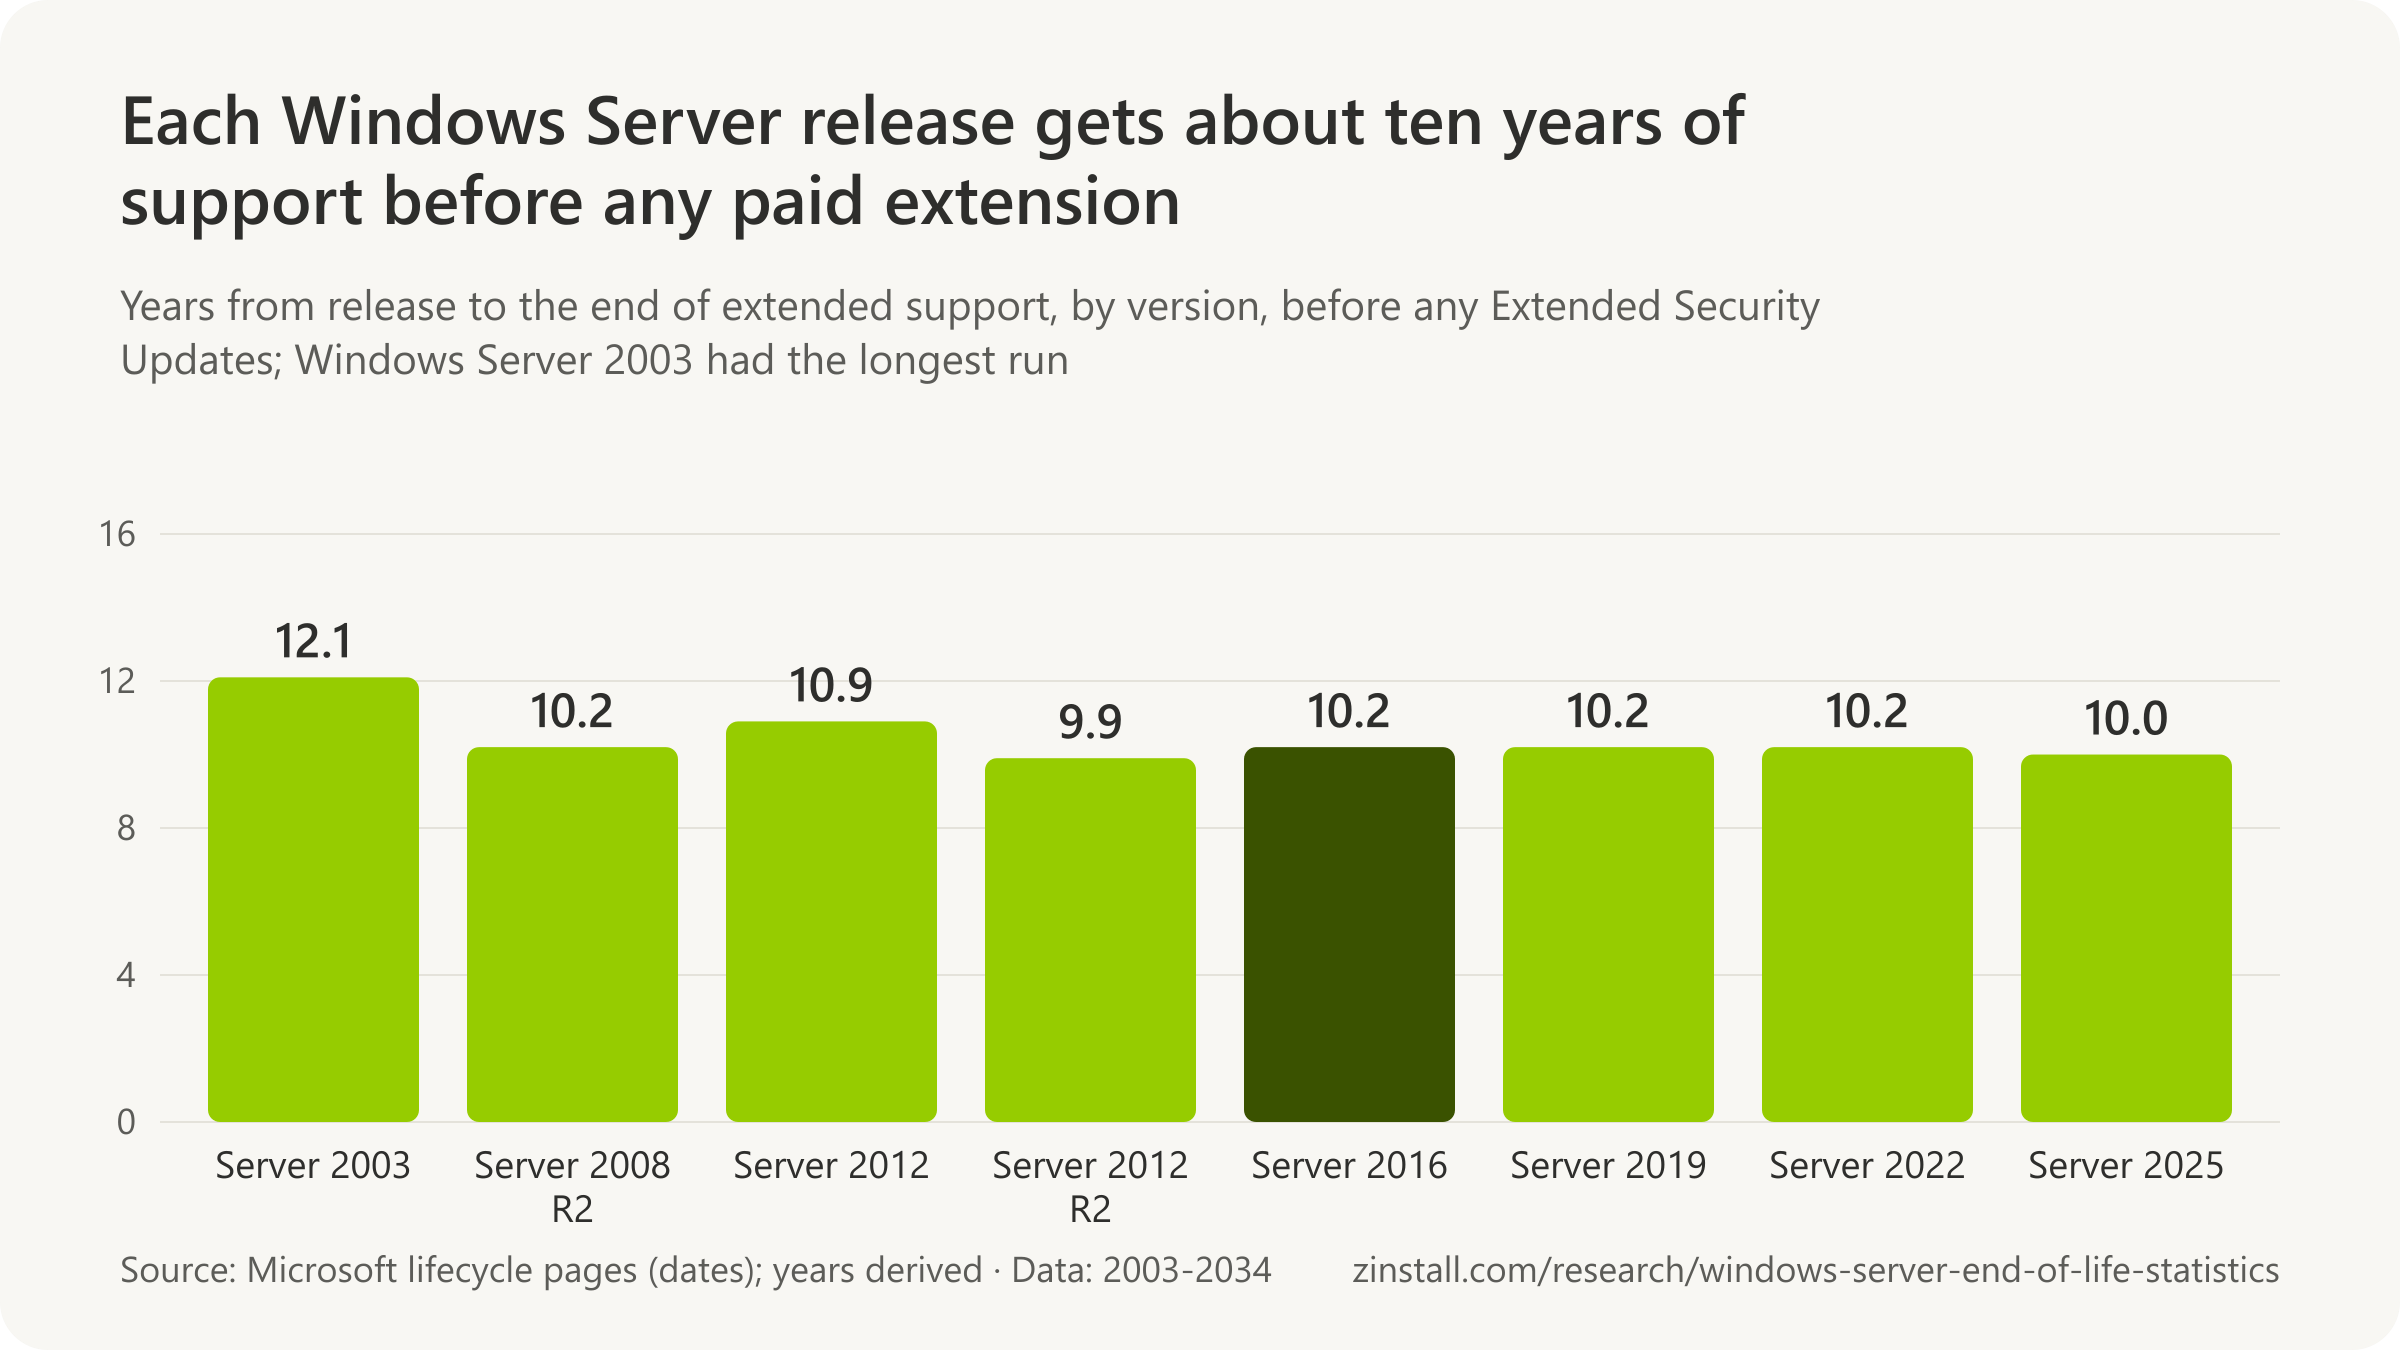
- Every Long-Term Servicing Channel release gets at least 10 years of support, five mainstream and five extended.
| Version | End of extended support |
|---|---|
| Windows Server 2003 | 14 July 2015 |
| Windows Server 2003 R2 | 14 July 2015 |
| Windows Server 2008 | 14 January 2020 |
| Windows Server 2008 R2 | 14 January 2020 |
| Windows Server 2012 | 10 October 2023 |
| Windows Server 2012 R2 | 10 October 2023 |
| Windows Server 2016 | 12 January 2027 |
| Windows Server 2019 | 9 January 2029 |
| Windows Server 2022 | 14 October 2031 |
| Windows Server 2025 | 14 November 2034 |
Sources: Microsoft (2022-2026)
More statistics (106)
Windows Server 2016 reaches the end of extended support on 12 January 2027, after mainstream support ended on 11 January 2022 (Microsoft, 2024).
Microsoft publishes a fixed lifecycle for every Windows Server release: years of mainstream support, years of extended support, and for some versions paid Extended Security Updates after that. The dates below come from the lifecycle page for each release. The aggregator sites that rank for these searches copy them, sometimes a day off, and leave out the ESU years and what they cost.
| Version | End of extended support | Scope |
|---|---|---|
| Windows Server 2003 | 14 July 2015 | Windows Server 2003, all editions (Datacenter, Enterprise, Standard and Web editions (32-bit, x64 and Itanium)) · Worldwide · 2015-07-14 |
| Windows Server 2003 R2 | 14 July 2015 | Windows Server 2003 R2, all editions (Datacenter, Enterprise and Standard editions (32-bit and x64)) · Worldwide · 2015-07-14 |
| Windows Server 2008 | 14 January 2020 | Windows Server 2008, all editions (Datacenter, Enterprise, Standard, Web, Foundation and Itanium editions (with and without Hyper-V)) · Worldwide · 2020-01-14 |
| Windows Server 2008 R2 | 14 January 2020 | Windows Server 2008 R2, all editions (Datacenter, Enterprise, HPC, Itanium, Standard and Web editions) · Worldwide · 2020-01-14 |
| Windows Server 2012 | 10 October 2023 | Windows Server 2012, all editions (Datacenter, Essentials, External Connector, Embedded, Foundation and Standard editions) · Worldwide · 2023-10-10 |
| Windows Server 2012 R2 | 10 October 2023 | Windows Server 2012 R2, all editions (Datacenter, Essentials, Embedded, Foundation and Standard editions) · Worldwide · 2023-10-10 |
| Windows Server 2016 | 12 January 2027 | Windows Server 2016, all editions (Datacenter, Essentials, MultiPoint Premium and Standard editions) · Worldwide · 2027-01-12 |
| Windows Server 2019 | 9 January 2029 | Windows Server 2019, all editions (Datacenter, Essentials and Standard editions) · Worldwide · 2029-01-09 |
| Windows Server 2022 | 14 October 2031 | Windows Server 2022, all editions (Datacenter, Datacenter: Azure Edition, Essentials and Standard editions) · Worldwide · 2031-10-14 |
| Windows Server 2025 | 14 November 2034 | Windows Server 2025, all editions (Datacenter, Datacenter: Azure Edition, Essentials and Standard editions) · Worldwide · 2034-11-14 |
| Version | End of mainstream support | Scope |
|---|---|---|
| Windows Server 2003 | 13 July 2010 | Windows Server 2003, all editions (Datacenter, Enterprise, Standard and Web editions (32-bit, x64 and Itanium)) · Worldwide · 2010-07-13 |
| Windows Server 2003 R2 | 13 July 2010 | Windows Server 2003 R2, all editions (Datacenter, Enterprise and Standard editions (32-bit and x64)) · Worldwide · 2010-07-13 |
| Windows Server 2008 | 13 January 2015 | Windows Server 2008, all editions (Datacenter, Enterprise, Standard, Web, Foundation and Itanium editions (with and without Hyper-V)) · Worldwide · 2015-01-13 |
| Windows Server 2008 R2 | 13 January 2015 | Windows Server 2008 R2, all editions (Datacenter, Enterprise, HPC, Itanium, Standard and Web editions) · Worldwide · 2015-01-13 |
| Windows Server 2012 | 9 October 2018 | Windows Server 2012, all editions (Datacenter, Essentials, External Connector, Embedded, Foundation and Standard editions) · Worldwide · 2018-10-09 |
| Windows Server 2012 R2 | 9 October 2018 | Windows Server 2012 R2, all editions (Datacenter, Essentials, Embedded, Foundation and Standard editions) · Worldwide · 2018-10-09 |
| Windows Server 2016 | 11 January 2022 | Windows Server 2016, all editions (Datacenter, Essentials, MultiPoint Premium and Standard editions) · Worldwide · 2022-01-11 |
| Windows Server 2019 | 9 January 2024 | Windows Server 2019, all editions (Datacenter, Essentials and Standard editions) · Worldwide · 2024-01-09 |
| Windows Server 2022 | 13 October 2026 | Windows Server 2022, all editions (Datacenter, Datacenter: Azure Edition, Essentials and Standard editions) · Worldwide · 2026-10-13 |
| Windows Server 2025 | 13 November 2029 | Windows Server 2025, all editions (Datacenter, Datacenter: Azure Edition, Essentials and Standard editions) · Worldwide · 2029-11-13 |
| Version | Released | Scope |
|---|---|---|
| Windows Server 2003 | 28 May 2003 | Windows Server 2003, all editions (Datacenter, Enterprise, Standard and Web editions (32-bit, x64 and Itanium)) · Worldwide · 2003-05-28 |
| Windows Server 2003 R2 | 5 March 2006 | Windows Server 2003 R2, all editions (Datacenter, Enterprise and Standard editions (32-bit and x64)) · Worldwide · 2006-03-05 |
| Windows Server 2008 | 6 May 2008 | Windows Server 2008, all editions (Datacenter, Enterprise, Standard, Web, Foundation and Itanium editions (with and without Hyper-V)) · Worldwide · 2008-05-06 |
| Windows Server 2008 R2 | 22 October 2009 | Windows Server 2008 R2, all editions (Datacenter, Enterprise, HPC, Itanium, Standard and Web editions) · Worldwide · 2009-10-22 |
| Windows Server 2012 | 30 October 2012 | Windows Server 2012, all editions (Datacenter, Essentials, External Connector, Embedded, Foundation and Standard editions) · Worldwide · 2012-10-30 |
| Windows Server 2012 R2 | 25 November 2013 | Windows Server 2012 R2, all editions (Datacenter, Essentials, Embedded, Foundation and Standard editions) · Worldwide · 2013-11-25 |
| Windows Server 2016 | 15 October 2016 | Windows Server 2016, all editions (Datacenter, Essentials, MultiPoint Premium and Standard editions) · Worldwide · 2016-10-15 |
| Windows Server 2019 | 13 November 2018 | Windows Server 2019, all editions (Datacenter, Essentials and Standard editions) · Worldwide · 2018-11-13 |
| Windows Server 2022 | 18 August 2021 | Windows Server 2022, all editions (Datacenter, Datacenter: Azure Edition, Essentials and Standard editions) · Worldwide · 2021-08-18 |
| Windows Server 2025 | 1 November 2024 | Windows Server 2025, all editions (Datacenter, Datacenter: Azure Edition, Essentials and Standard editions) · Worldwide · 2024-11-01 |
| Programme and milestone | Date or term | Scope |
|---|---|---|
| Windows Server 2008 and 2008 R2: last ESU year outside Azure ended | 10 January 2023 | Windows Server 2008 R2 with Extended Security Updates · Worldwide · 2023-01-10 |
| Windows Server 2008 R2: ESU years in all, the fourth on Azure only | 4 years | Windows Server 2008 R2 with Extended Security Updates · Worldwide · 2020-01-14 to 2024-01-09 |
| Windows Server 2008 and 2008 R2: extra year, Azure only | +1 year on Azure | Microsoft's ESU terms for Windows Server 2008 and 2008 R2 (documentation) · Worldwide · 2023-01 to 2024-01 |
| Windows Server 2012 and 2012 R2: paid ESU years after October 2023 | 3 years | Microsoft's Extended Security Update terms for Windows Server 2012 and 2012 R2 (documentation) · Worldwide · 2023-10-10 to 2026-10-13 |
| Windows Server 2012 and 2012 R2: yearly ESU windows | 3 windows | Microsoft's ESU availability table (documentation) · Worldwide · 2023-10-10 to 2026-10-13 |
| Windows Server 2012 and 2012 R2: last paid ESU year ended | 13 October 2026 | Windows Server 2012 and 2012 R2 with Extended Security Updates · Worldwide · 2026-10-13 |
| Windows Server 2012: Azure Arc ESU licences deactivated | 14 October 2026 (00:00 UTC) | Windows Server 2012 and 2012 R2 servers enrolled in ESUs enabled by Azure Arc · Worldwide · 2026-10-14 |
| Windows Server 2016: ESU announced | 25 February 2026 | Windows Server 2016 customers (Microsoft announcement) · Worldwide · 2026-02-25 |
| Windows Server 2016: ESU term through Azure Arc | 3 years (through 2030) | Windows Server 2016 Standard and Datacenter servers enrolled in ESUs enabled by Azure Arc · Worldwide · 2027-01-13 to 2030-01 |
| Windows Server 2016: ESU enrolment opened and billing starts | 3 August 2026 (enrolment), 13 January 2027 (billing) | Windows Server 2016 servers enrolled in ESUs enabled by Azure Arc · Worldwide · 2026-08-03 |
| Any Long-Term Servicing Channel release: minimum support before ESU | 10 years | Microsoft's Windows Server lifecycle policy (documentation) · Worldwide · 2025 |
| Version or interval | Years or days | Scope |
|---|---|---|
| Windows Server 2003: release to end of extended support | 12.1 years | Windows Server 2003 (Microsoft lifecycle dates) · Worldwide · 2003-05-28 to 2015-07-14 |
| Windows Server 2003 R2: release to end of extended support | 9.4 years | Windows Server 2003 R2 (Microsoft lifecycle dates) · Worldwide · 2006-03-05 to 2015-07-14 |
| Windows Server 2008: release to end of extended support | 11.7 years | Windows Server 2008 (Microsoft lifecycle dates) · Worldwide · 2008-05-06 to 2020-01-14 |
| Windows Server 2008 R2: release to end of extended support | 10.2 years | Windows Server 2008 R2 (Microsoft lifecycle dates) · Worldwide · 2009-10-22 to 2020-01-14 |
| Windows Server 2012: release to end of extended support | 10.9 years | Windows Server 2012 (Microsoft lifecycle dates) · Worldwide · 2012-10-30 to 2023-10-10 |
| Windows Server 2012 R2: release to end of extended support | 9.9 years | Windows Server 2012 R2 (Microsoft lifecycle dates) · Worldwide · 2013-11-25 to 2023-10-10 |
| Windows Server 2016: release to end of extended support | 10.2 years | Windows Server 2016 (Microsoft lifecycle dates) · Worldwide · 2016-10-15 to 2027-01-12 |
| Windows Server 2019: release to end of extended support | 10.2 years | Windows Server 2019 (Microsoft lifecycle dates) · Worldwide · 2018-11-13 to 2029-01-09 |
| Windows Server 2022: release to end of extended support | 10.2 years | Windows Server 2022 (Microsoft lifecycle dates) · Worldwide · 2021-08-18 to 2031-10-14 |
| Windows Server 2025: release to end of extended support | 10.0 years | Windows Server 2025 (Microsoft lifecycle dates) · Worldwide · 2024-11-01 to 2034-11-14 |
| Windows Server 2012 R2: release to end of paid ESU | 4,705 days | Windows Server 2012 R2 (Microsoft lifecycle dates) · Worldwide · 2013-11-25 to 2026-10-13 |
| Since Windows Server 2012's ESU ended, at 14 October 2026 | 1 day | Windows Server 2012 and 2012 R2 (Microsoft lifecycle dates) · Worldwide · 2026-10-14 |
| To Windows Server 2016's end of support, from 14 October 2026 | 90 days | Windows Server 2016 (Microsoft lifecycle dates) · Worldwide · 2026-10-14 to 2027-01-12 |
Hyper-V Server, Essentials and the release channels
- Hyper-V Server 2008, released on 30 December 2008, reached the end of extended support on 14 January 2020, after mainstream support ended on 14 January 2014 (Microsoft, 2022).
- Hyper-V Server 2008 R2, released on 22 October 2009, reached the end of extended support on 14 January 2020, after mainstream support ended on 14 January 2014 (Microsoft, 2022).
- Hyper-V Server 2012, released on 30 October 2012, reached the end of extended support on 10 October 2023, after mainstream support ended on 9 January 2018 (Microsoft, 2022).
- Hyper-V Server 2012 R2, released on 25 November 2013, reached the end of extended support on 10 October 2023, after mainstream support ended on 9 January 2018 (Microsoft, 2022).
- Hyper-V Server 2016, released on 15 October 2016, reaches the end of extended support on 12 January 2027, after mainstream support ended on 11 January 2022 (Microsoft, 2021).
- Hyper-V Server 2019, released on 13 November 2018, reaches the end of extended support on 9 January 2029, after mainstream support ended on 9 January 2024 (Microsoft, 2024).
- Windows Server 2012 Essentials was released on 2 January 2013, two months after Windows Server 2012, and shares its lifecycle, which ended extended support on 10 October 2023 (Microsoft, 2024).
- 6 Windows Server lifecycle pages, 2012 to 2025, list Essentials as an edition, so Essentials servers follow their version's dates; Microsoft keeps no separate lifecycle page for Windows Server Essentials (Microsoft, 2024).
- Windows Server's Semi-Annual Channel was retired on 9 August 2022, ending the model of a new release every six months that ran from version 1709 in October 2017 to version 20H2 (Microsoft, 2023).
- 7 Semi-Annual Channel releases of Windows Server shipped between October 2017 (version 1709) and October 2020 (version 20H2), each supported for about 18 months, before the channel's retirement in August 2022 (Microsoft, 2023).
- Windows Server's Annual Channel, the Modern Lifecycle successor to the Semi-Annual Channel, started on 24 October 2023 and has no fixed end date (Microsoft, 2023).
- 24 months of support (18 mainstream plus 6 extended) and a release about every 12 months define Windows Server's Annual Channel for Containers, the Server Core-only channel that replaced the Semi-Annual Channel in October 2023 (Microsoft, 2025).
- Every 2 to 3 years is the typical cadence of a new Long-Term Servicing Channel release of Windows Server, each with five years of mainstream and five years of extended support, per Microsoft's servicing-channels page (Microsoft, 2025).
- 3 editions make up Windows Server 2025 in Microsoft's editions comparison: Standard, Datacenter and Datacenter: Azure Edition, the last being virtual-only and limited to Azure and Azure Local (Microsoft, 2025).
- Windows Server 2022 Datacenter: Azure Edition, whose lifecycle started on 2 November 2021, reached the end of mainstream support on 13 October 2026 and reaches the end of extended support on 14 October 2031, the same end dates as Windows Server 2022 (Microsoft, 2025).
- Windows Server 2025 Datacenter in its Azure edition follows Microsoft's Modern Lifecycle Policy, with a lifecycle start of 10 September 2024 and no fixed end date, unlike the ten-year fixed dates of Windows Server 2025 (Microsoft, 2025).
- 2 major product updates in the first 3 years, delivered yearly through Windows Update, distinguish Windows Server Datacenter: Azure Edition, a virtual-only edition for Azure and Azure Local with no on-premises physical installs (Microsoft, 2025).
SQL Server and Exchange Server
| Version and milestone | Date or term | Scope |
|---|---|---|
| SQL Server 2008: end of extended support | 9 July 2019 | SQL Server 2008, all editions · Worldwide · 2019-07-09 |
| SQL Server 2008 R2: end of extended support | 9 July 2019 | SQL Server 2008 R2, all editions · Worldwide · 2019-07-09 |
| SQL Server 2008 and 2008 R2: ESU years, the fourth on Azure only | 4 years | SQL Server 2008 and 2008 R2 with Extended Security Updates · Worldwide · 2019-07-09 to 2023-07-11 |
| SQL Server 2012: end of extended support | 12 July 2022 | SQL Server 2012, all editions · Worldwide · 2022-07-12 |
| SQL Server 2012: ESU ended | 8 July 2025 | SQL Server 2012 with Extended Security Updates · Worldwide · 2025-07-08 |
| SQL Server 2014: end of extended support | 9 July 2024 | SQL Server 2014, all editions · Worldwide · 2024-07-09 |
| SQL Server 2014: ESU ends | 12 July 2027 | SQL Server 2014 with Extended Security Updates · Worldwide · 2027-07-12 |
| SQL Server 2016: end of extended support | 14 July 2026 | SQL Server 2016, all editions · Worldwide · 2026-07-14 |
| SQL Server 2016: ESU started | 14 July 2026 | SQL Server 2016 with Extended Security Updates · Worldwide · 2026-07-14 |
| SQL Server 2017: end of extended support | 12 October 2027 | SQL Server 2017, all editions · Worldwide · 2027-10-12 |
| SQL Server 2019: end of extended support | 8 January 2030 | SQL Server 2019, all editions · Worldwide · 2030-01-08 |
| SQL Server 2022: end of extended support | 11 January 2033 | SQL Server 2022, all editions · Worldwide · 2033-01-11 |
- Exchange Server 2016, released on 1 October 2015, reached the end of extended support on 14 October 2025, after mainstream support ended on 13 October 2020 (Microsoft, 2024).
- Exchange Server 2019, released on 22 October 2018, reached the end of extended support on 14 October 2025, after mainstream support ended on 9 January 2024 (Microsoft, 2024).
- Exchange Server Subscription Edition was released on 1 July 2025 under the Modern Lifecycle Policy, with no fixed end date, a little over three months before Exchange Server 2016 and 2019 left extended support (Microsoft, 2025).
Dates that drift
| Site, version and milestone | Date the site gives | Scope |
|---|---|---|
| Innov8: Windows Server 2016, end of extended support | 11 January 2027 (Microsoft: 12 January 2027) | Windows Server lifecycle dates as listed by a UK Sage reseller's end-of-life page · Worldwide · 2027-01-11 |
| Block64: Windows Server 2016, end of extended support | 11 January 2027 (Microsoft: 12 January 2027) | Windows Server 2016 end-of-support date as printed by an IT-asset-discovery vendor's blog · Worldwide · 2027-01-11 |
| Bluesource: Windows Server 2016, end of extended support | 13 January 2027 (Microsoft: 12 January 2027) | Windows Server 2016 end-of-support date as printed by a Microsoft licensing partner's blog · Worldwide · 2027-01-13 |
| WPS Office: Windows Server 2016, end of extended support | 14 July 2026 (Microsoft: 12 January 2027) | Windows Server 2016 end-of-support date as printed by a software vendor's blog · Worldwide · 2026-07-14 |
| Petri: Windows Server 2016, end of extended support (typo) | 12 January 2017 (Microsoft: 12 January 2027) | Windows Server 2016 end-of-support date as printed by trade press · Worldwide · 2017-01-12 |
| Itechtics: Windows Server 2016, release | 16 October 2016 (Microsoft: 15 October 2016) | Windows Server lifecycle dates as listed by a dates aggregator · Worldwide · 2016-10-16 |
| Itechtics: Windows Server 2012 R2, release | 13 November 2013 (Microsoft: 25 November 2013) | Windows Server lifecycle dates as listed by a dates aggregator · Worldwide · 2013-11-13 |
| Itechtics: Windows Server 2012 R2, end of extended support | 13 October 2026 (Microsoft: 10 October 2023) | Windows Server lifecycle dates as listed by a dates aggregator · Worldwide · 2026-10-13 |
| Innov8: Windows Server 2025, end of mainstream support | 9 October 2029 (Microsoft: 13 November 2029) | Windows Server lifecycle dates as listed by a UK Sage reseller's end-of-life page · Worldwide · 2029-10-09 |
| Itechtics: Windows Server 2025, end of mainstream support | 9 October 2029 (Microsoft: 13 November 2029) | Windows Server lifecycle dates as listed by a dates aggregator · Worldwide · 2029-10-09 |
| Innov8: Windows Server 2025, end of extended support | 9 October 2034 (Microsoft: 14 November 2034) | Windows Server lifecycle dates as listed by a UK Sage reseller's end-of-life page · Worldwide · 2034-10-09 |
| Itechtics: Windows Server 2025, end of extended support | 10 October 2034 (Microsoft: 14 November 2034) | Windows Server lifecycle dates as listed by a dates aggregator · Worldwide · 2034-10-10 |
- 5 of 23 web pages checked on 14 October 2026 gave a Windows Server 2016 end-of-support date other than the 12 January 2027 on Microsoft's lifecycle page: 11 January 2027 twice, 13 January 2027, 14 July 2026 and a 2017 typo (comparison with Microsoft's lifecycle page, 2026).
- 3 of the Windows Server 2012 to 2025 dates on Innov8's end-of-life page differ from Microsoft's lifecycle pages in October 2026; the page has no Windows Server 2012 R2 row and lists no Extended Security Update dates or prices (Innov8, 2026).
- 5 of the Windows Server 2012 R2 to 2025 dates on Itechtics' lifecycle page differ from Microsoft's lifecycle pages, and the page says Windows Server 2012 R2 was the last version offered Extended Security Updates, which Microsoft has since announced for 2016 (Itechtics, 2024).
- 0 of the Windows Server 2012 R2 to 2025 dates on endoflife.date differ from Microsoft's lifecycle pages in September 2026, and it lists Extended Security Updates for Windows Server 2016 to 12 January 2030 but no prices (endoflife.date, 2026).
- 0 of the Windows Server 2012 R2 to 2025 dates on endoflife.ai differ from Microsoft's lifecycle pages in October 2026, but its table shows no Extended Security Updates for Windows Server 2016 and no ESU prices (endoflife.ai, 2026).
- 0 of the Windows Server 2012 R2 to 2025 dates in Jimber's end-of-life timeline differ from Microsoft's lifecycle pages, but it prices Extended Security Updates at about 75%, 100% and 125% of the licence price in years one to three (Jimber, 2026).
- 0 of the Windows Server 2012 R2 to 2025 dates on Raff Technologies' end-of-life page differ from Microsoft's lifecycle pages, but it says the per-server ESU price roughly doubles each year (Raff Technologies, 2026).
- 0 of the Windows Server 2012 R2 to 2025 end-of-support dates on Lansweeper's Windows Server end-of-life page differ from Microsoft's lifecycle pages in June 2026, and it gives no Windows Server 2016 ESU or prices (Lansweeper, 2026).
Sources: Microsoft (2021-2026); Innov8 Technology; Block64; Bluesource; WPS Office; Petri; Itechtics; endoflife.date; endoflife.ai; Jimber; Raff Technologies; Lansweeper
How many servers still run Windows Server 2012 and 2016?

- An IT-inventory audit in September 2023 covered 1.3 million Windows Server instances at more than 35,000 organisations.
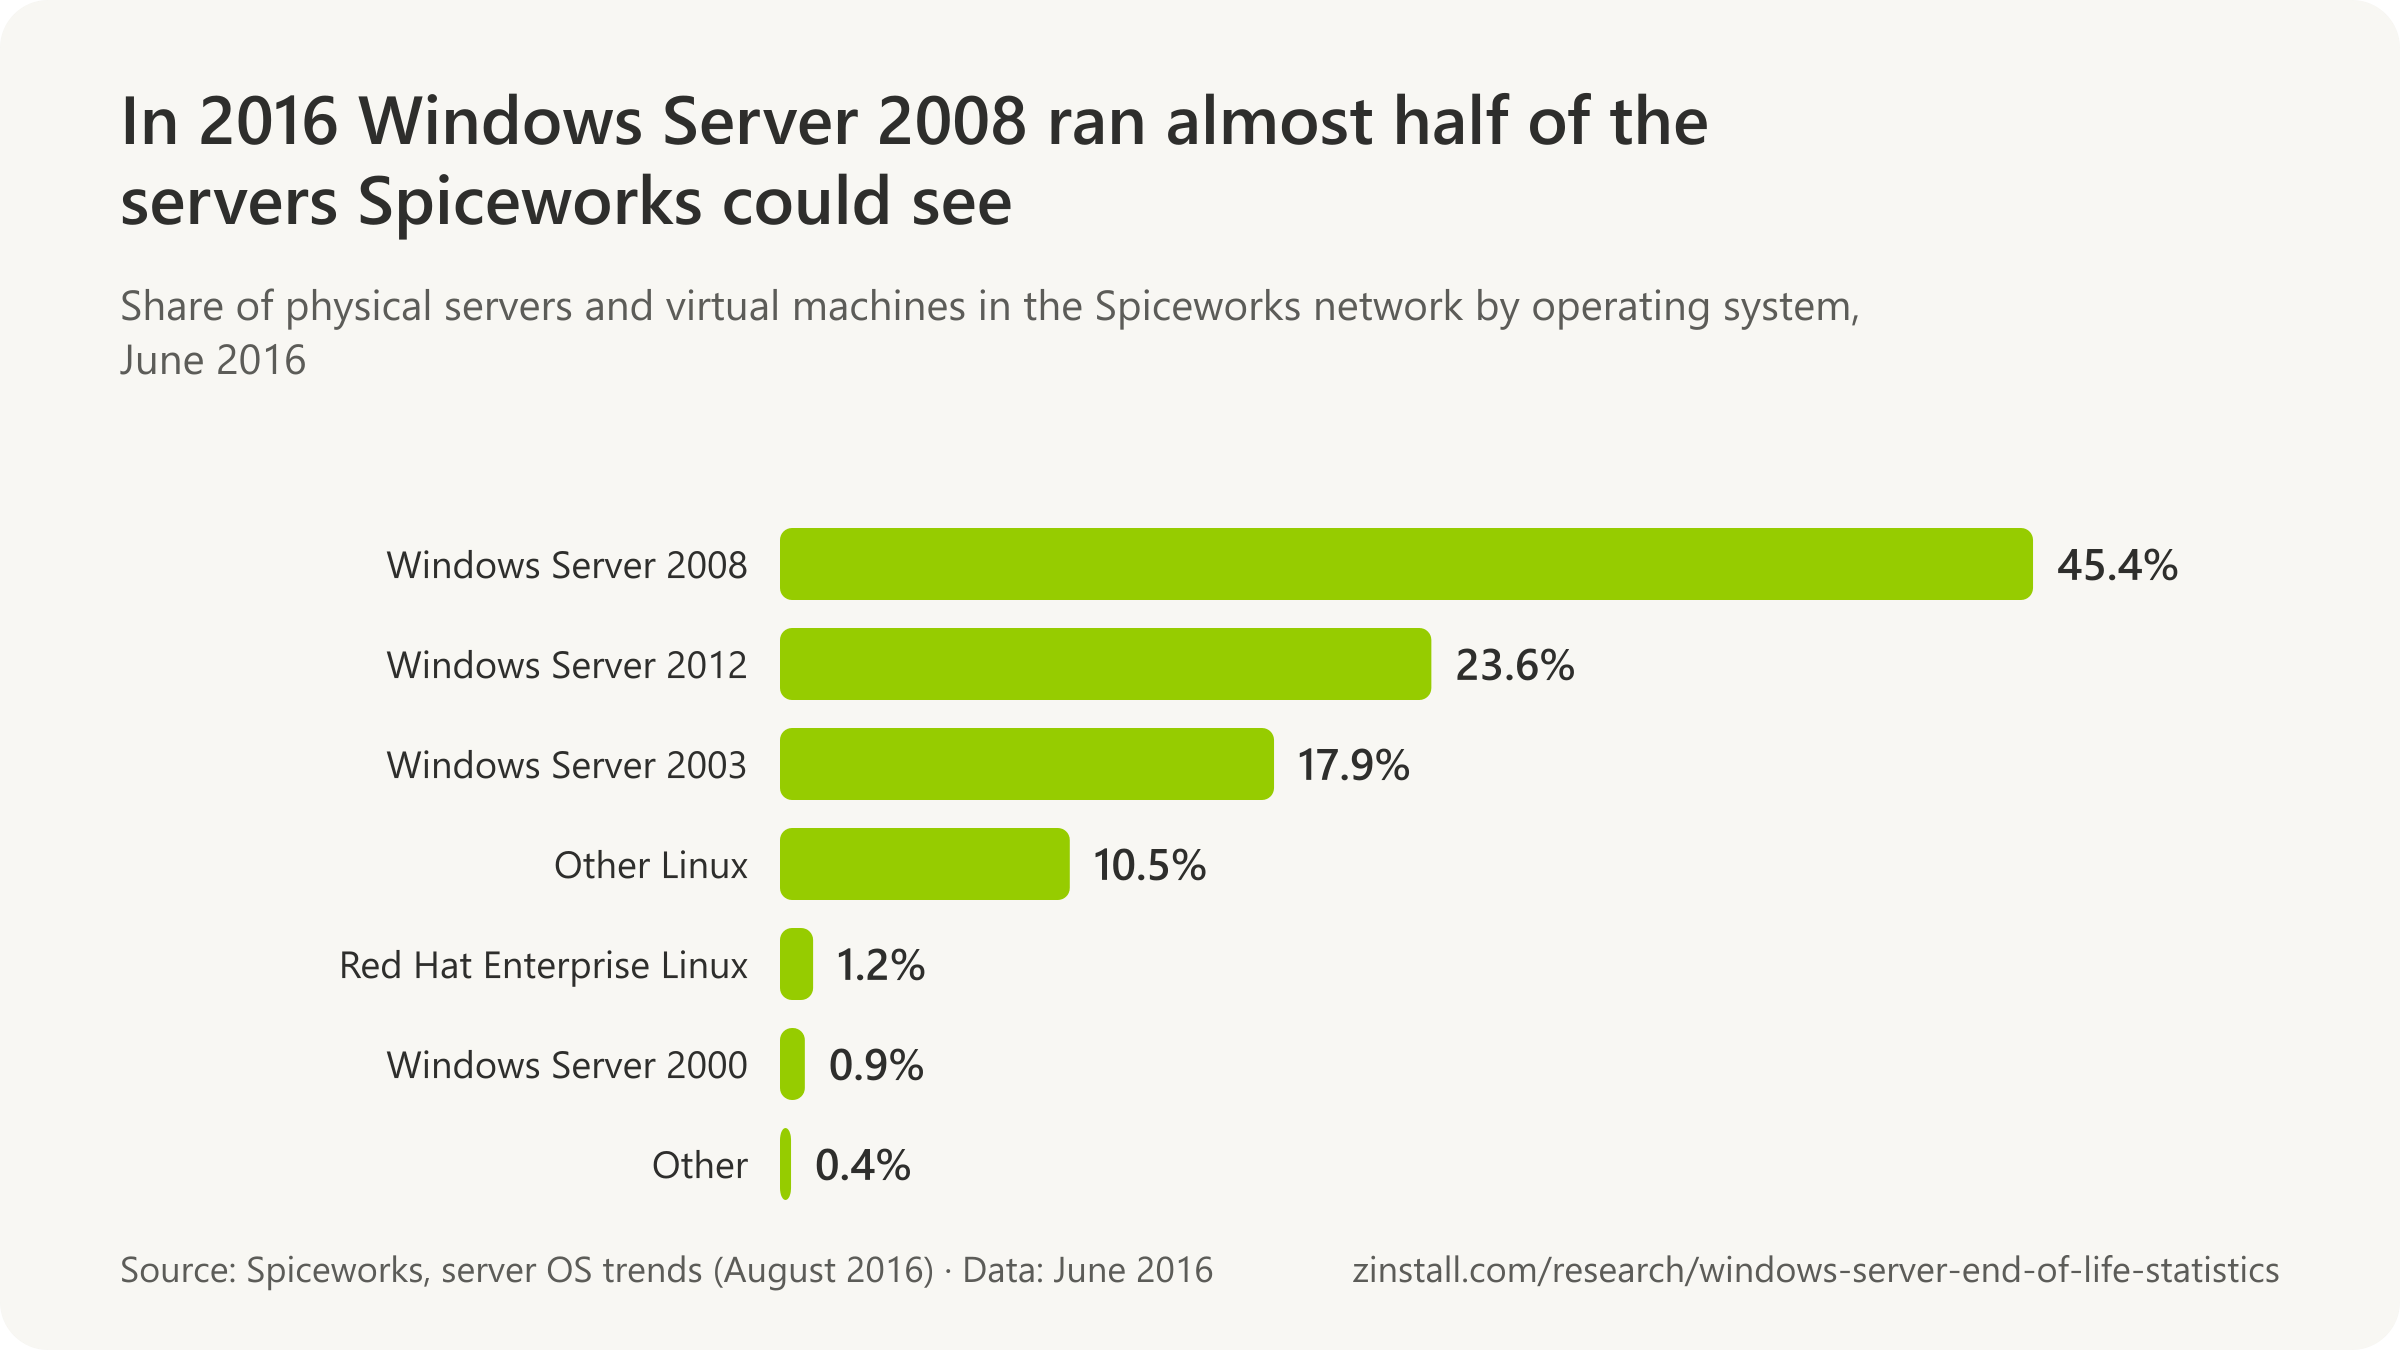
- In June 2016, Windows Server 2008 ran 45.4% of the servers and virtual machines Spiceworks could see.
- 19.8% of the SQL Server instances Lansweeper scanned were past support in June 2024.
- 34% of Dutch firms with 50 or more staff used Windows Server 2012 in 2017; Wikipedia made it 35% of servers.
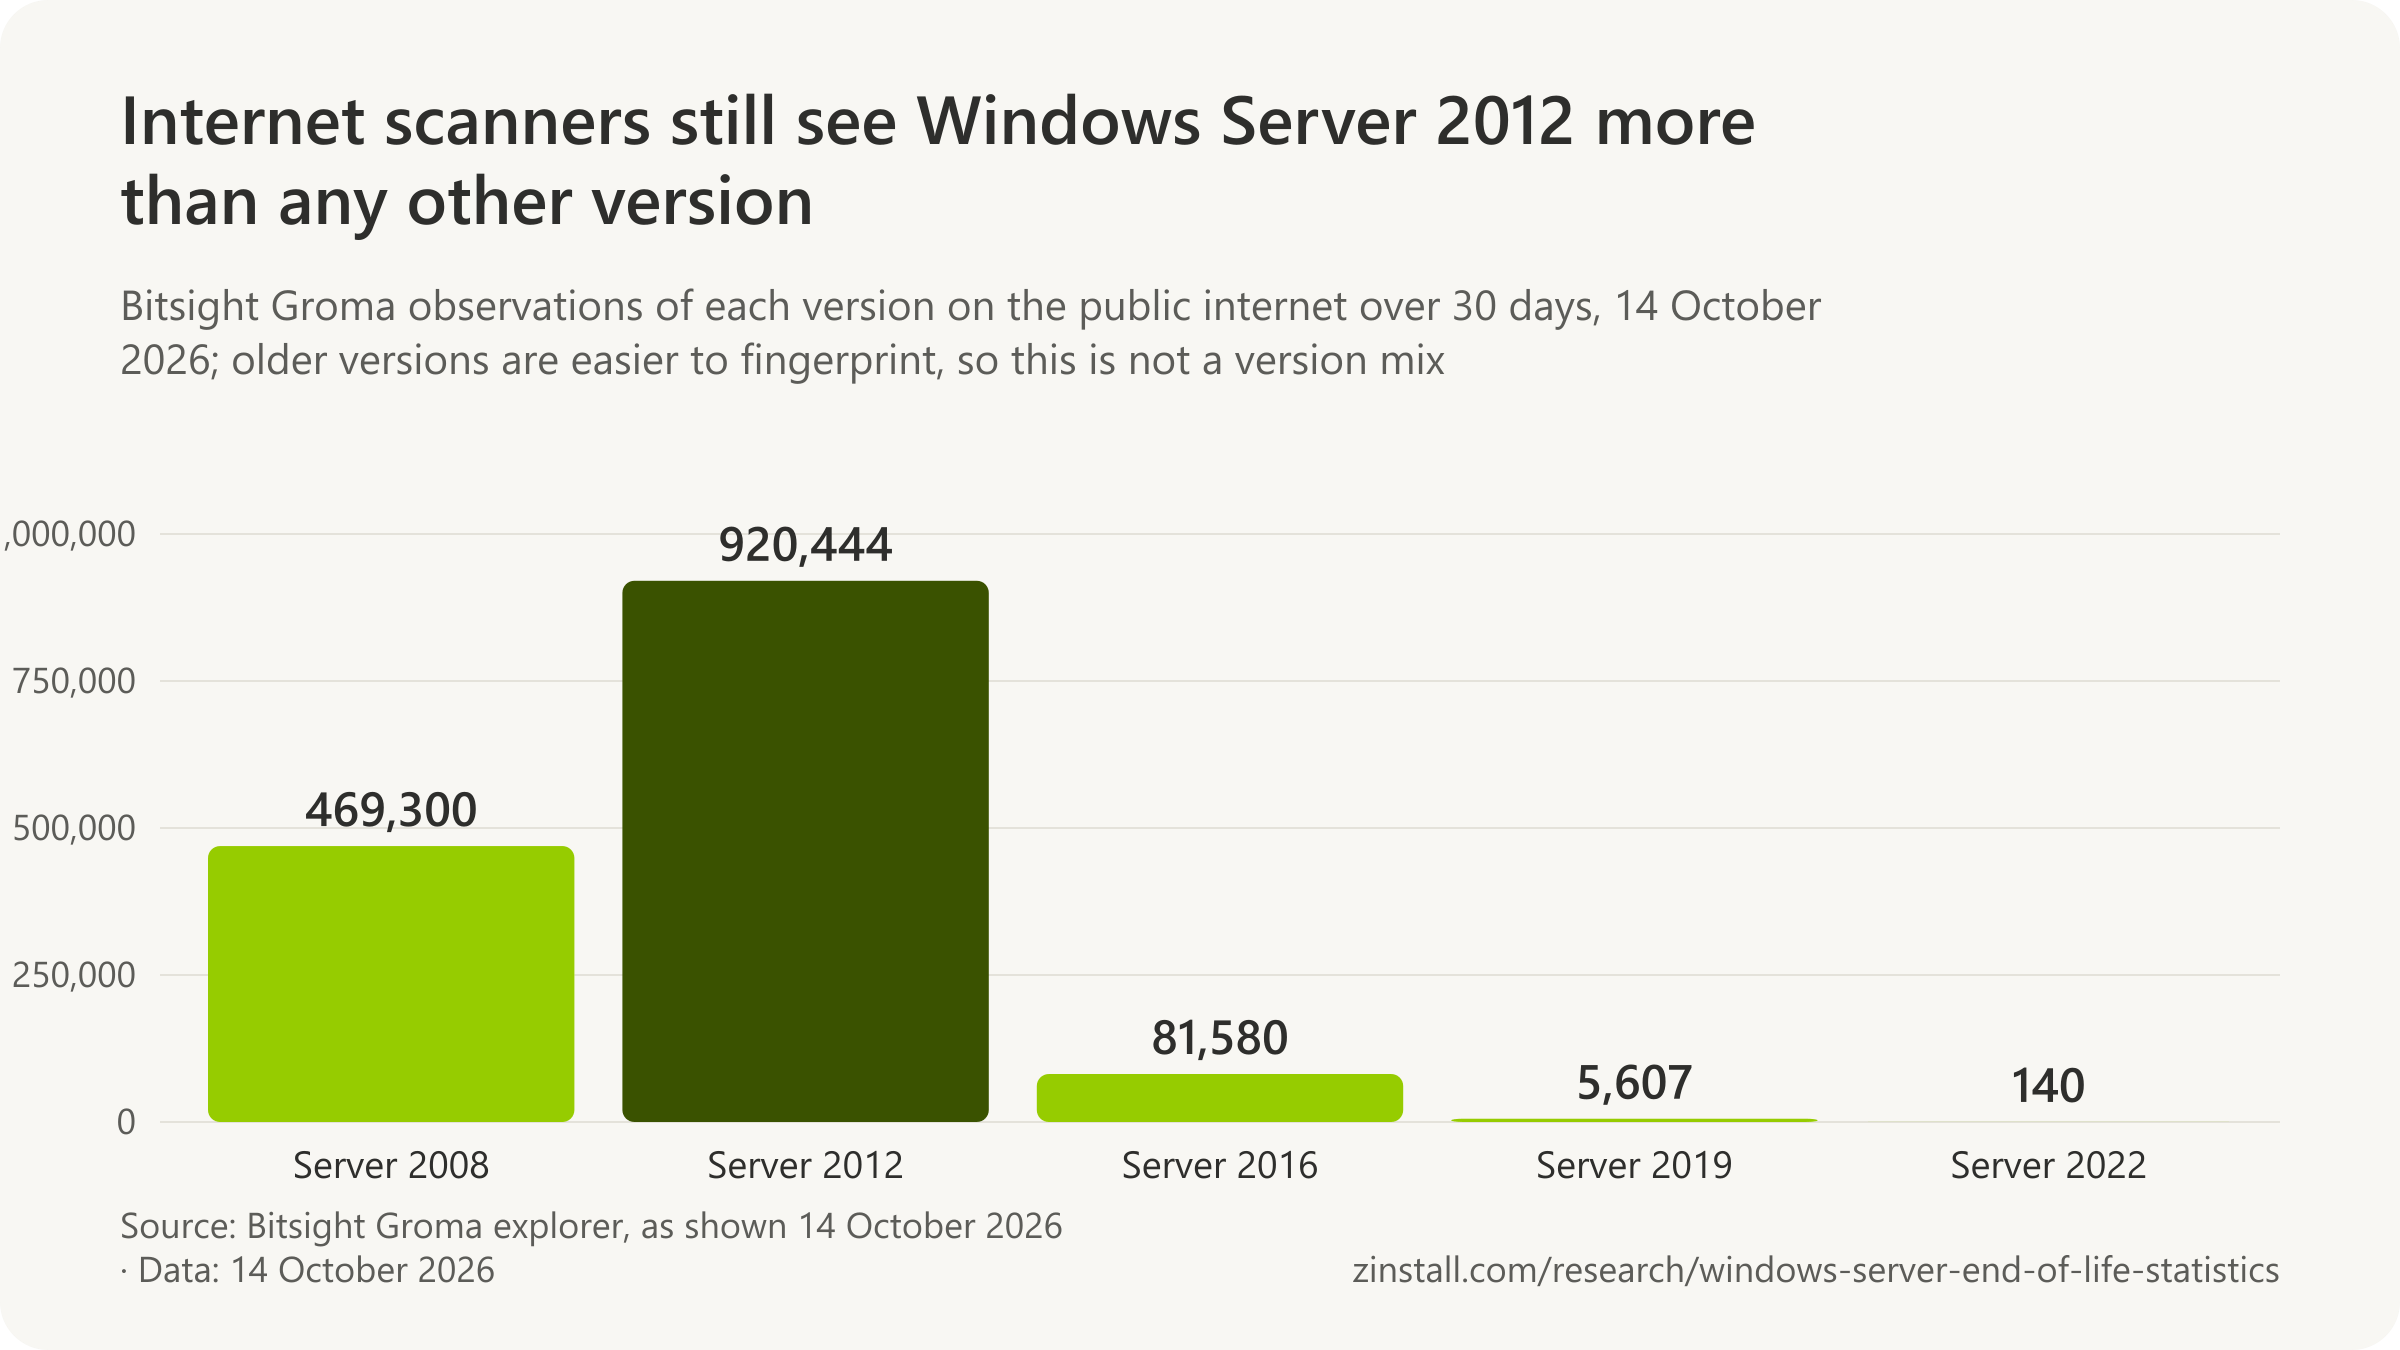
| Version | Observations |
|---|---|
| Windows Server 2008 | 469,300 |
| Windows Server 2012 | 920,444 |
| Windows Server 2016 | 81,580 |
| Windows Server 2019 | 5,607 |
| Windows Server 2022 | 140 |
Sources: Techzine; Spiceworks; The Register (2026, 2024); Smart Profile; Bitsight (2026); Redmond Channel Partner; Redmond Magazine
More statistics (53)
20.9% of 1.3 million Windows Server instances inventoried by Lansweeper at more than 35,000 organisations were still running Windows Server 2012 or 2012 R2 five weeks before its 10 October 2023 end of support (Lansweeper data via Techzine, 2023).
Nobody counts every server. What exists are audits of the servers that asset-management tools can see, surveys of IT departments, and scans of what answers on the internet. Each measures a different population, which is why every share below is named with its own.
| Audit and measure | Figure | Scope |
|---|---|---|
| September 2023: Windows Server instances still on 2012 or 2012 R2 | 20.9% | 1.3 million Windows Server instances at more than 35,000 organisations inventoried by Lansweeper's IT asset-management software (vendor scan data, reported by Techzine with the chart caption 'Source: Lansweeper') · Worldwide (Lansweeper customer base) · 2023-09 |
| September 2023: already on an unsupported version | 6.7% | 1.3 million Windows Server instances at more than 35,000 organisations inventoried by Lansweeper's IT asset-management software (vendor scan data, reported by Techzine with the chart caption 'Source: Lansweeper') · Worldwide (Lansweeper customer base) · 2023-09 |
| September 2023: outside support after 10 October 2023 without ESU (derived) | 27.7% | 1.3 million Windows Server instances at more than 35,000 organisations inventoried by Lansweeper's IT asset-management software (vendor scan data, reported by Techzine with the chart caption 'Source: Lansweeper') · Worldwide (Lansweeper customer base) · 2023-09 |
| September 2023: instances in the sample | 1.3 million | 1.3 million Windows Server instances at more than 35,000 organisations inventoried by Lansweeper's IT asset-management software (vendor scan data, reported by Techzine with the chart caption 'Source: Lansweeper') · Worldwide (Lansweeper customer base) · 2023-09 |
| March 2026: servers on Windows Server 2016 | 20.3% | Servers monitored by Lansweeper's asset-discovery platform at its customers (vendor telemetry; the article gives no instance count or date of extraction) · Worldwide (Lansweeper customer base) · 2026-03 |
| Version and date | Share of instances | Scope |
|---|---|---|
| SQL Server 2019, June 2024 | 44% | Just over one million SQL Server instances scanned by Lansweeper's agents in its customer base (vendor scan data, reported by The Register from an interview with Lansweeper's chief strategy officer Roel Decneut) · Worldwide (Lansweeper customer base) · 2024-06 |
| SQL Server 2017, June 2024 | 13.5% | Just over one million SQL Server instances scanned by Lansweeper's agents in its customer base (vendor scan data, reported by The Register from an interview with Lansweeper's chief strategy officer Roel Decneut) · Worldwide (Lansweeper customer base) · 2024-06 |
| SQL Server 2014, June 2024 | 12% | Just over one million SQL Server instances scanned by Lansweeper's agents in its customer base (vendor scan data, reported by The Register from an interview with Lansweeper's chief strategy officer Roel Decneut) · Worldwide (Lansweeper customer base) · 2024-06 |
| SQL Server 2012, June 2024 | 9% | Just over one million SQL Server instances scanned by Lansweeper's agents in its customer base (vendor scan data, reported by The Register from an interview with Lansweeper's chief strategy officer Roel Decneut) · Worldwide (Lansweeper customer base) · 2024-06 |
| SQL Server 2008, June 2024 | under 8% | Just over one million SQL Server instances scanned by Lansweeper's agents in its customer base (vendor scan data, reported by The Register from an interview with Lansweeper's chief strategy officer Roel Decneut) · Worldwide (Lansweeper customer base) · 2024-06 |
| Past support, June 2024 | 19.8% | Just over one million SQL Server instances scanned by Lansweeper's agents in its customer base (vendor scan data, reported by The Register from an interview with Lansweeper's chief strategy officer Roel Decneut) · Worldwide (Lansweeper customer base) · 2024-06 |
| Past support once SQL Server 2014 left, July 2024 | 32% | Just over one million SQL Server instances scanned by Lansweeper's agents in its customer base (vendor scan data, reported by The Register from an interview with Lansweeper's chief strategy officer Roel Decneut) · Worldwide (Lansweeper customer base) · 2024-07 |
| Instances in the June 2024 sample | just over 1 million | Just over one million SQL Server instances scanned by Lansweeper's agents in its customer base (vendor scan data, reported by The Register from an interview with Lansweeper's chief strategy officer Roel Decneut) · Worldwide (Lansweeper customer base) · 2024-06 |
| SQL Server 2014, 2026 | 17% | SQL Server instances in Lansweeper's customer inventories (vendor scan data; sample size not stated on the page) · Worldwide (Lansweeper customer base) · 2026-06 |

| Measure | Share | Scope |
|---|---|---|
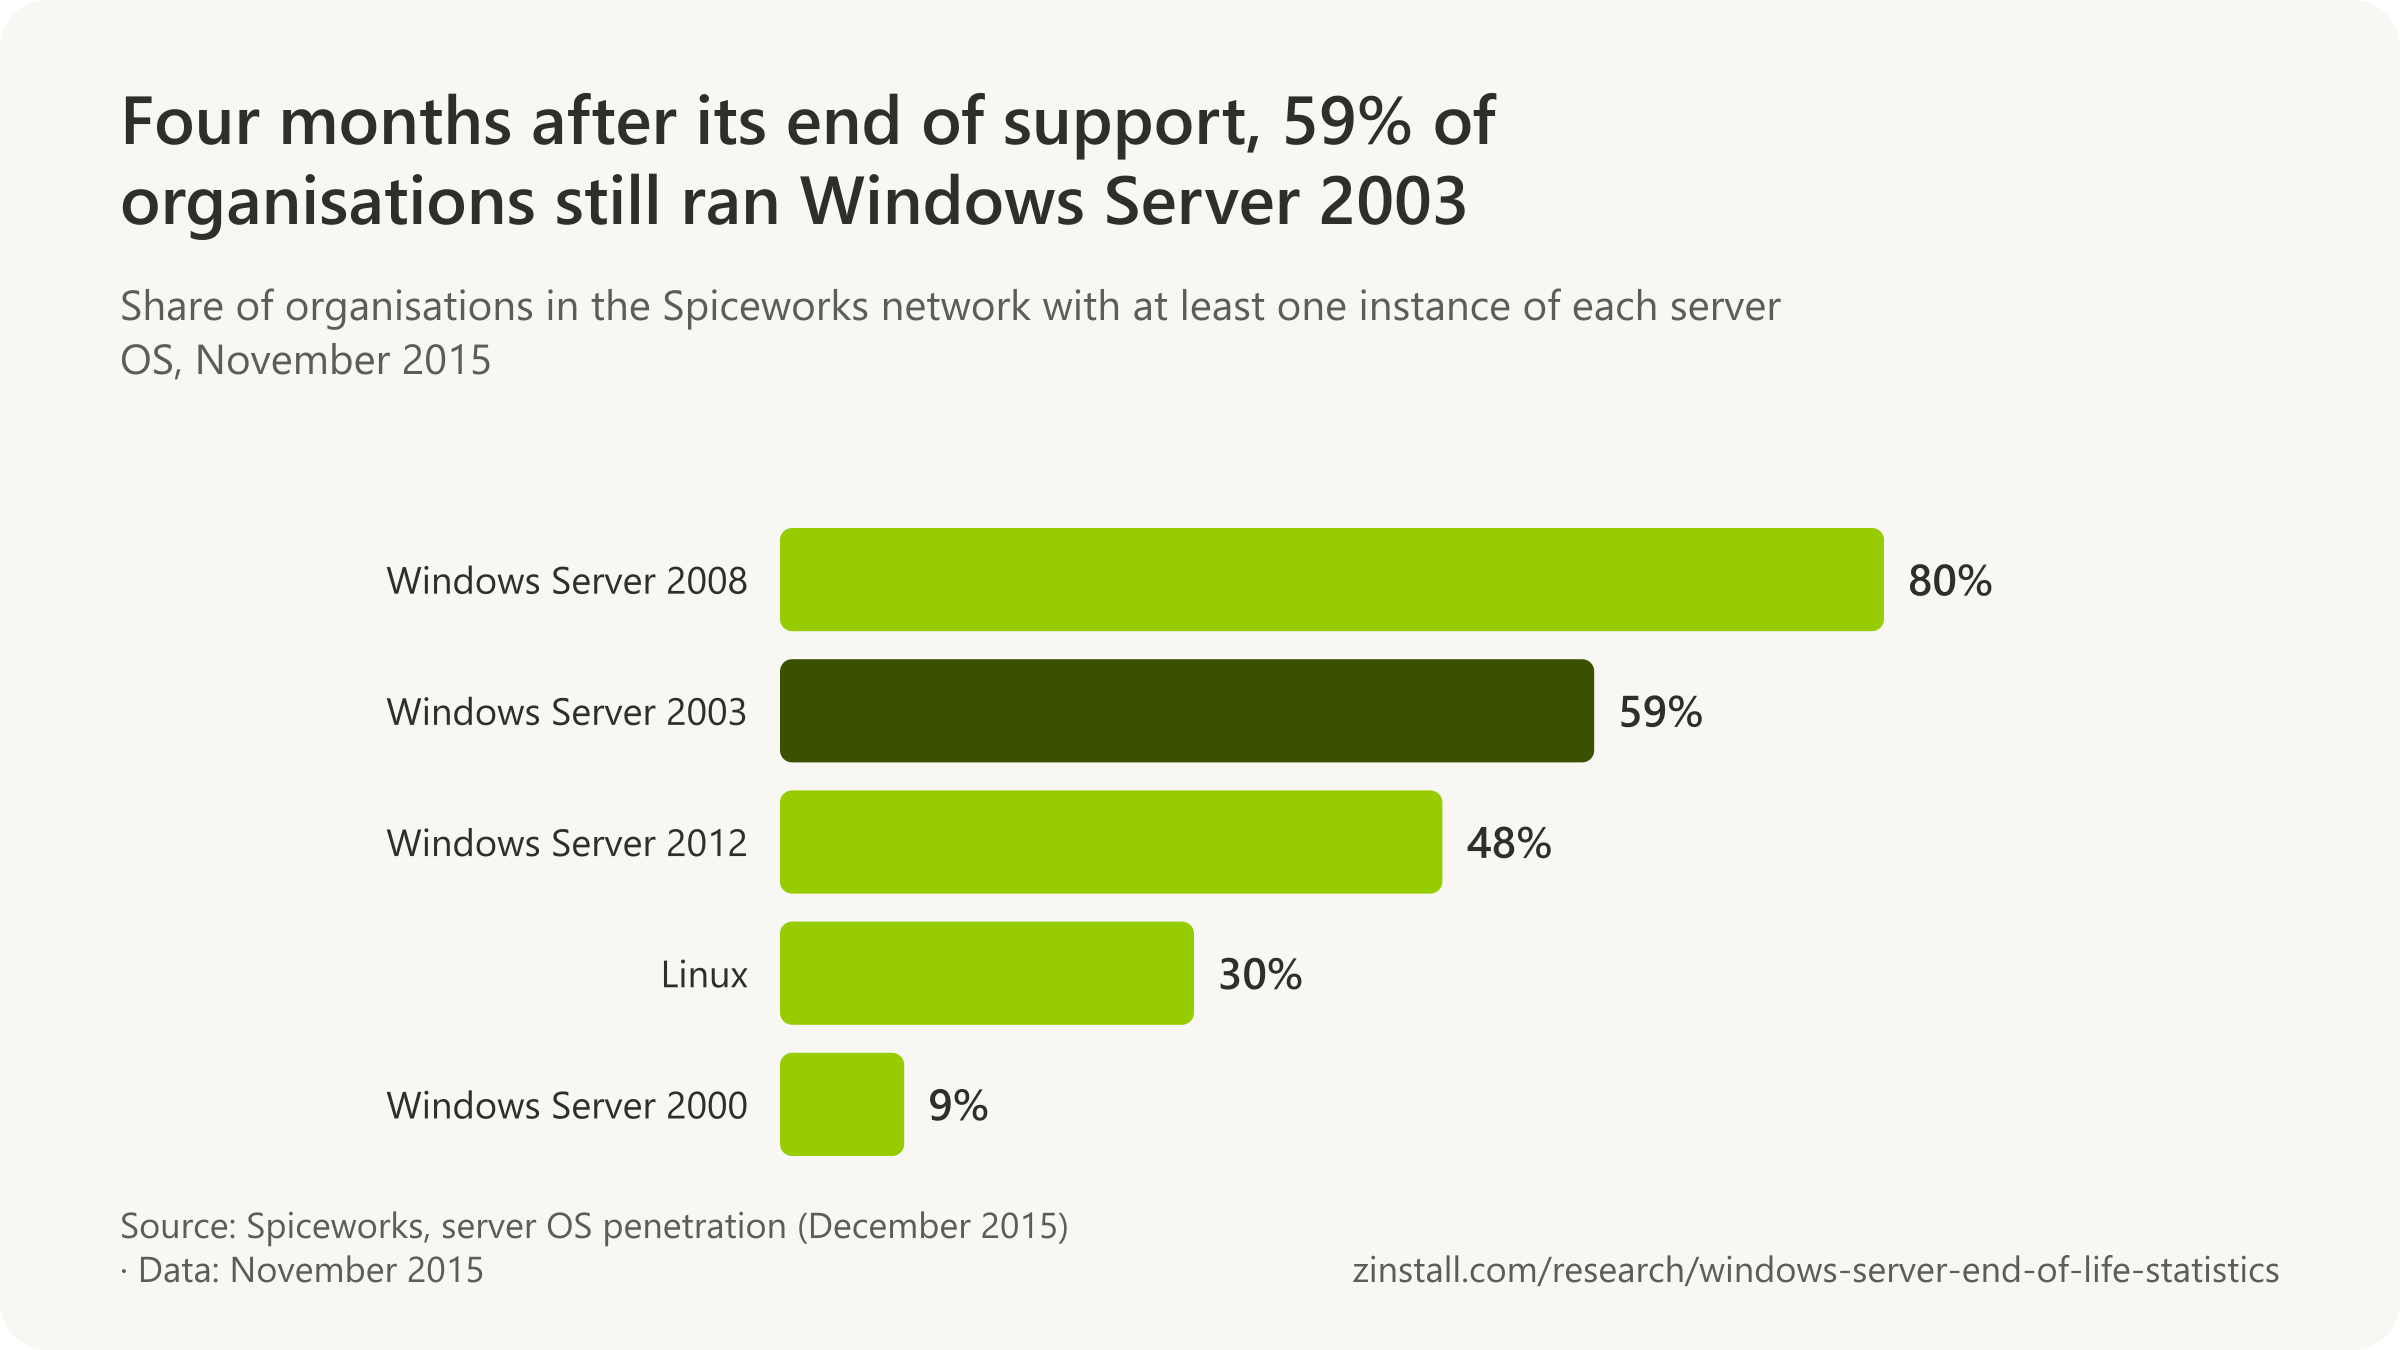
| Organisations with Windows Server 2008, November 2015 | 80% | Organisations in the Spiceworks network (anonymised, aggregated usage data from Spiceworks' free inventory software), share with at least one instance of each server OS ('penetration rate'), November 2015 · Worldwide (Spiceworks network, mostly small and mid-sized businesses) · 2015-11 |
| November 2015 | 59% | Organisations in the Spiceworks network (anonymised, aggregated usage data from Spiceworks' free inventory software), share with at least one instance of each server OS ('penetration rate'), November 2015 · Worldwide (Spiceworks network, mostly small and mid-sized businesses) · 2015-11 |
| Organisations with Windows Server 2012, November 2015 | 48% | Organisations in the Spiceworks network (anonymised, aggregated usage data from Spiceworks' free inventory software), share with at least one instance of each server OS ('penetration rate'), November 2015 · Worldwide (Spiceworks network, mostly small and mid-sized businesses) · 2015-11 |
| Organisations with a Linux server, November 2015 | 30% | Organisations in the Spiceworks network (anonymised, aggregated usage data from Spiceworks' free inventory software), share with at least one instance of each server OS ('penetration rate'), November 2015 · Worldwide (Spiceworks network, mostly small and mid-sized businesses) · 2015-11 |
| Organisations with Windows Server 2000, November 2015 | 9% | Organisations in the Spiceworks network (anonymised, aggregated usage data from Spiceworks' free inventory software), share with at least one instance of each server OS ('penetration rate'), November 2015 · Worldwide (Spiceworks network, mostly small and mid-sized businesses) · 2015-11 |
| Servers and VMs on Windows Server, mid-2016 | 87.7% | Physical servers and virtual machines in the Spiceworks network (organisations running Spiceworks' free inventory software, mostly on-premises), by server operating system · Worldwide (Spiceworks network, mostly small and mid-sized businesses) · 2016-06 |
| Servers and VMs on Windows Server 2008, June 2016 | 45.4% | Physical servers and virtual machines, and the organisations running them, in Spiceworks' anonymised network inventory data, June 2016 (mostly on-premises, skewed to small and mid-sized businesses) · Worldwide (Spiceworks network, mostly on-premises) · 2016-06 |
| Servers and VMs on Windows Server 2012, June 2016 | 23.6% | Physical servers and virtual machines, and the organisations running them, in Spiceworks' anonymised network inventory data, June 2016 (mostly on-premises, skewed to small and mid-sized businesses) · Worldwide (Spiceworks network, mostly on-premises) · 2016-06 |
| Servers and VMs on Windows Server 2003, June 2016 | 17.9% | Physical servers and virtual machines, and the organisations running them, in Spiceworks' anonymised network inventory data, June 2016 (mostly on-premises, skewed to small and mid-sized businesses) · Worldwide (Spiceworks network, mostly on-premises) · 2016-06 |
| Servers and VMs on Linux, mid-2016 | 11.7% | Physical servers and virtual machines in the Spiceworks network (organisations running Spiceworks' free inventory software, mostly on-premises), by server operating system · Worldwide (Spiceworks network, mostly small and mid-sized businesses) · 2016-06 |
| Servers and VMs on Windows Server 2000, mid-2016 | 0.9% | Physical servers and virtual machines in the Spiceworks network (organisations running Spiceworks' free inventory software, mostly on-premises), by server operating system · Worldwide (Spiceworks network, mostly small and mid-sized businesses) · 2016-06 |

- 17% of about 300 IT professionals surveyed by Spiceworks in November 2015 planned to adopt Windows Server 2016 within its first year, while 23% had no plans to adopt it and 20% did not know (Spiceworks, 2015).
- 12% of businesses were running Windows Server 2012 a year after its September 2012 release, according to Spiceworks data reported by Network World in December 2015 (Spiceworks via Network World, 2015).
- 88% of 'organisations' servers' ran Windows Server in SC Media's July 2016 report of Spiceworks' inventory data, which Spiceworks gives as 87.7% of the physical servers and VMs in its network (SC Media, 2016).
What internet scanners see
| Version | Observations |
|---|---|
| Windows Server 2008 | 469,300 |
| Windows Server 2012 | 920,444 |
| Windows Server 2016 | 81,580 |
| Windows Server 2019 | 5,607 |
| Windows Server 2022 | 140 |

| Country | Observations | Scope |
|---|---|---|
| United States | 239,107 | Software observations on the public-facing internet by Bitsight's Groma scanning engine over the prior 30 days, each identified by an address, port and domain name (so one host with several domains or ports counts more than once); shown on 2026-10-14 · United States · 2026-10-14 |
| China | 134,044 | Software observations on the public-facing internet by Bitsight's Groma scanning engine over the prior 30 days, each identified by an address, port and domain name (so one host with several domains or ports counts more than once); shown on 2026-10-14 · China · 2026-10-14 |
| Hong Kong | 36,097 | Software observations on the public-facing internet by Bitsight's Groma scanning engine over the prior 30 days, each identified by an address, port and domain name (so one host with several domains or ports counts more than once); shown on 2026-10-14 · Hong Kong · 2026-10-14 |
| Germany | 35,873 | Software observations on the public-facing internet by Bitsight's Groma scanning engine over the prior 30 days, each identified by an address, port and domain name (so one host with several domains or ports counts more than once); shown on 2026-10-14 · Germany · 2026-10-14 |
| United Kingdom | 31,760 | Software observations on the public-facing internet by Bitsight's Groma scanning engine over the prior 30 days, each identified by an address, port and domain name (so one host with several domains or ports counts more than once); shown on 2026-10-14 · United Kingdom · 2026-10-14 |

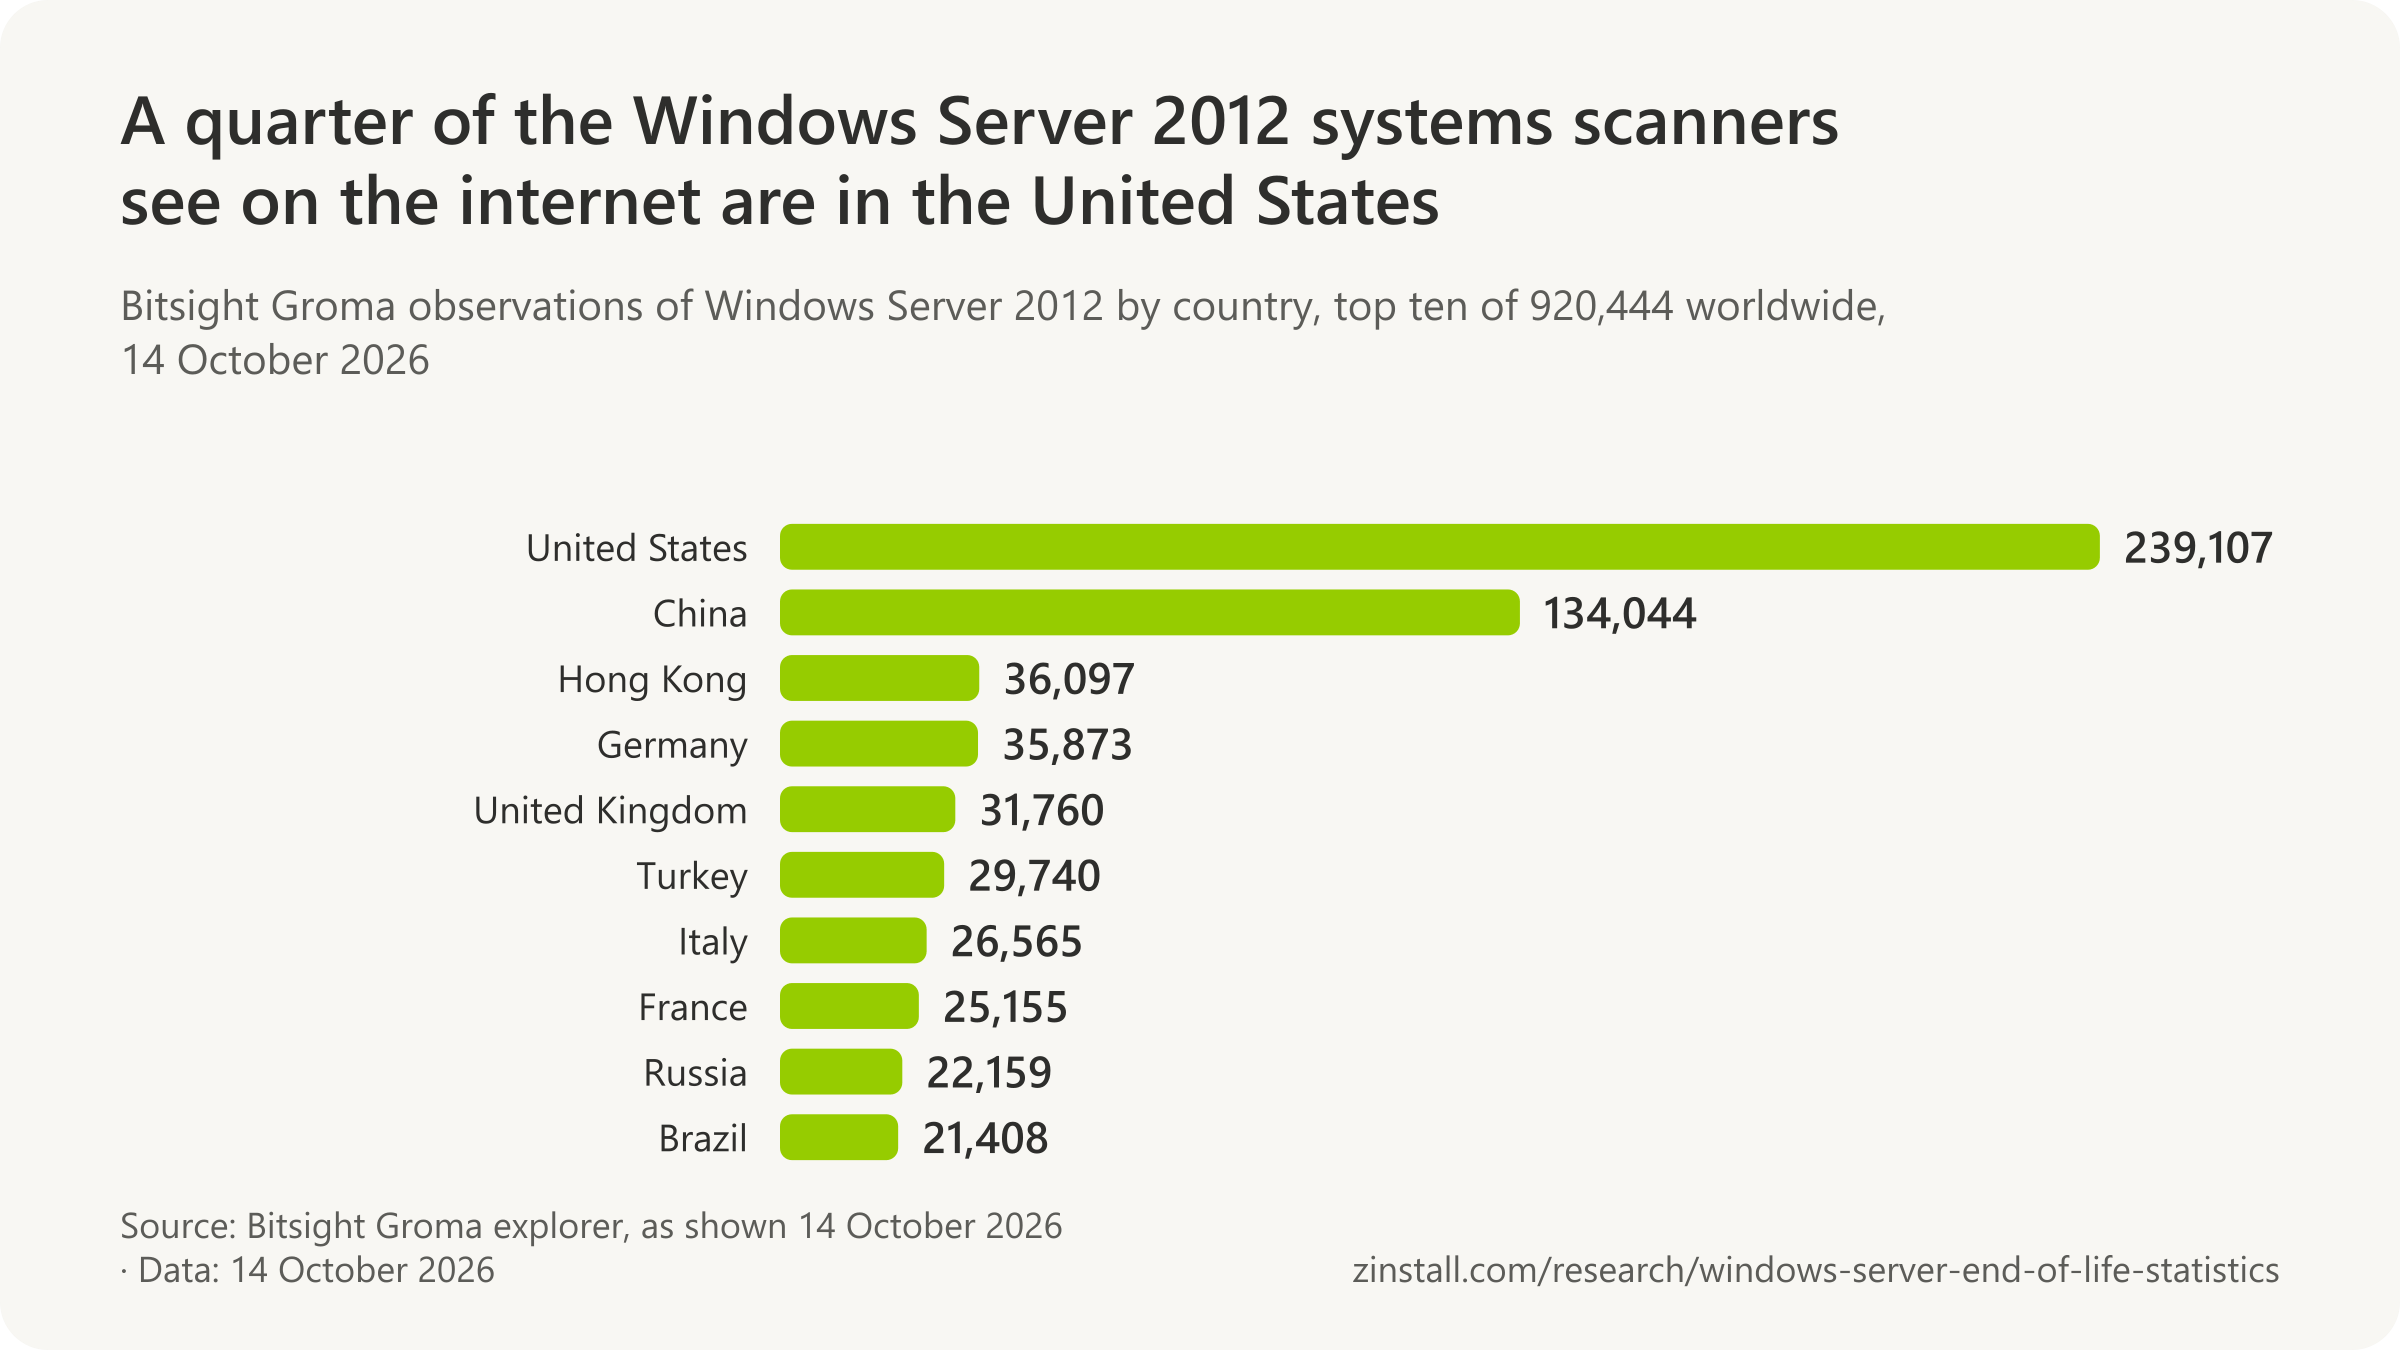
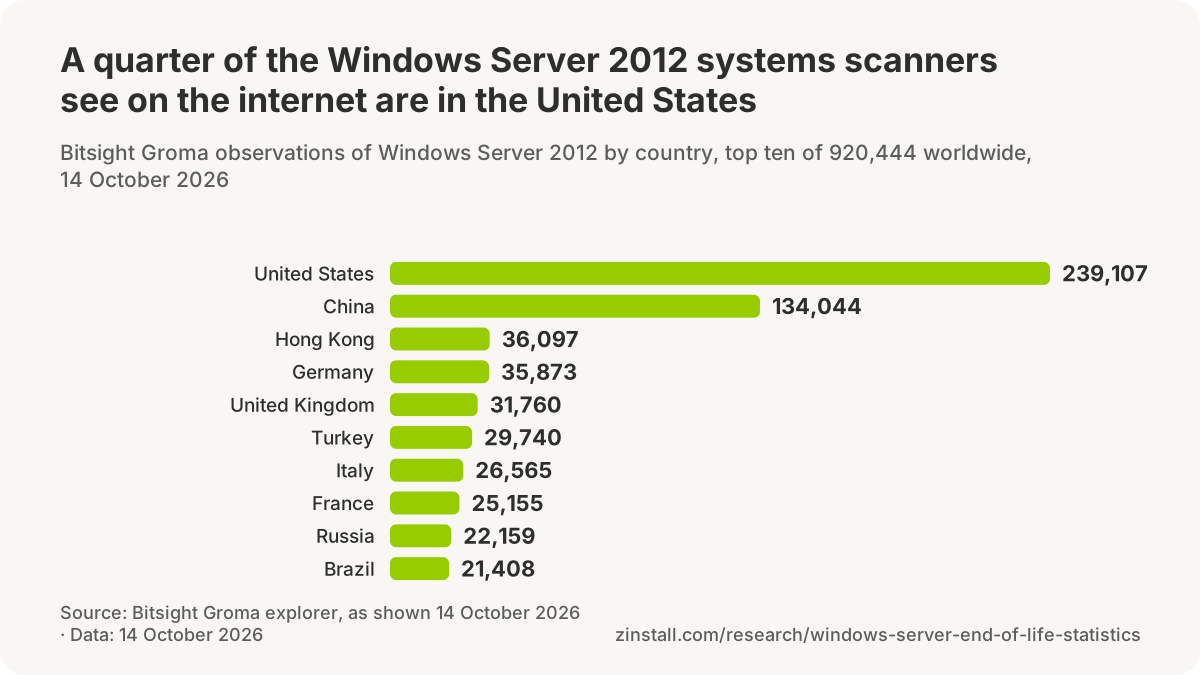
- 920,380 of the 920,444 Windows Server 2012 observations in Bitsight's Groma explorer on 14 October 2026 carried no sub-version (60 were tagged 'r2' and 4 '6.2.9200'), so the count does not separate Windows Server 2012 from 2012 R2 (Bitsight, 2026).
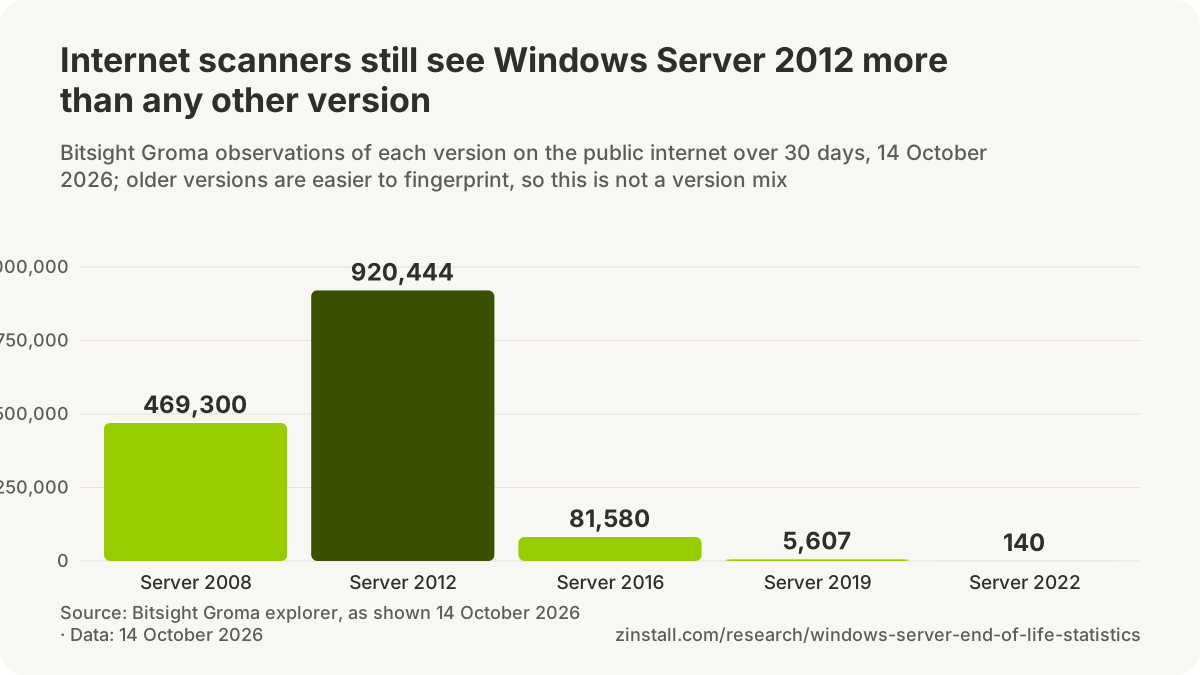
- 11.3 times as many internet observations of Windows Server 2012 (920,444) as of Windows Server 2016 (81,580) were shown by Bitsight's Groma explorer on 14 October 2026 (derived from Bitsight, 2026).
- 129,747 observations of Windows Server 2008 (27.7% of the 469,300 worldwide) were located in China and 107,746 (23.0%) in the United States in Bitsight's Groma explorer as shown on 14 October 2026 (Bitsight, 2026).
- 19,528 observations of Windows Server 2016 (24.0% of the 81,580 worldwide) were located in the United States and 8,271 (10.2%) in Germany in Bitsight's Groma explorer as shown on 14 October 2026 (Bitsight, 2026).
Surveys outside the big audits
- 34% of Dutch businesses with 50 or more employees said they used Windows Server 2012 in April 2017, about level with Windows Server 2008, in Smart Profile's analysis of about 2,000 interviews (Smart Profile, 2017).
- 55% of Dutch businesses with 50 or more employees used Windows Server 2008 at its 2013 peak, five years after its release, the pattern Smart Profile expected Windows Server 2012 and 2016 to follow (Smart Profile, 2017).
- About 2.5% of Dutch businesses with 50 or more employees used Windows Server 2016 by August 2017, ten months after its October 2016 release (Smart Profile, 2017).
- Approximately 12% of Dutch businesses with 50 or more employees used a Linux server in 2017, a share that had hovered around 10% for years, with UNIX at about 1.5% and OS/400 at about 3% of locations (Smart Profile, 2017).
| Vendor, version and measure | Figure | Scope |
|---|---|---|
| Enlyft: companies using Windows Server 2012 | 37,487 companies | Companies in Enlyft's B2B database tagged with Windows Server 2012 (cumulative evidence, up to 10 years 11 months old) · Worldwide · 2026-10 |
| 6sense: Windows Server 2012 customers | 27,732 (June 2025: 9,402) | Companies in 6sense's database tagged with Windows Server 2012 · Worldwide · 2026-10 |
| 6sense: Windows Server 2016 customers | 10,774 (UK 746) | Companies in 6sense's database tagged with Windows Server 2016 · Worldwide · 2026-10 |
| TheirStack: companies using Windows Server 2012 (from job postings) | 9,178 companies | Companies with job postings mentioning Windows Server 2012 (TheirStack's job-posting dataset) · Worldwide · 2026-10 |
| Enlyft: Windows Server 2012's share of its operating systems category | about 0.5% | Companies in Enlyft's database tagged as using Windows Server 2012, built by 'scanning billions of public documents' with 'indexing techniques combined with advanced data science' (no sampling frame, date of observation or definition of 'use' published) · Worldwide (Enlyft database) · 2026-10-14 |
| Enlyft: Windows Server 2012 users in the United States | 46% | Companies in Enlyft's database tagged as using Windows Server 2012, built by 'scanning billions of public documents' with 'indexing techniques combined with advanced data science' (no sampling frame, date of observation or definition of 'use' published) · United States · 2026-10-14 |
Sources: Techzine; The Register (2024, 2026); Lansweeper; Spiceworks (2015, 2016); Network World; SC Media; Bitsight (2026); Smart Profile (2017); Enlyft; 6sense (2026); TheirStack
What are the security risks of an unsupported Windows Server?
49 actively exploited vulnerabilities affecting Windows Server 2012 R2 were catalogued by US authorities during its three paid update years (CISA and Microsoft, counted 2026).

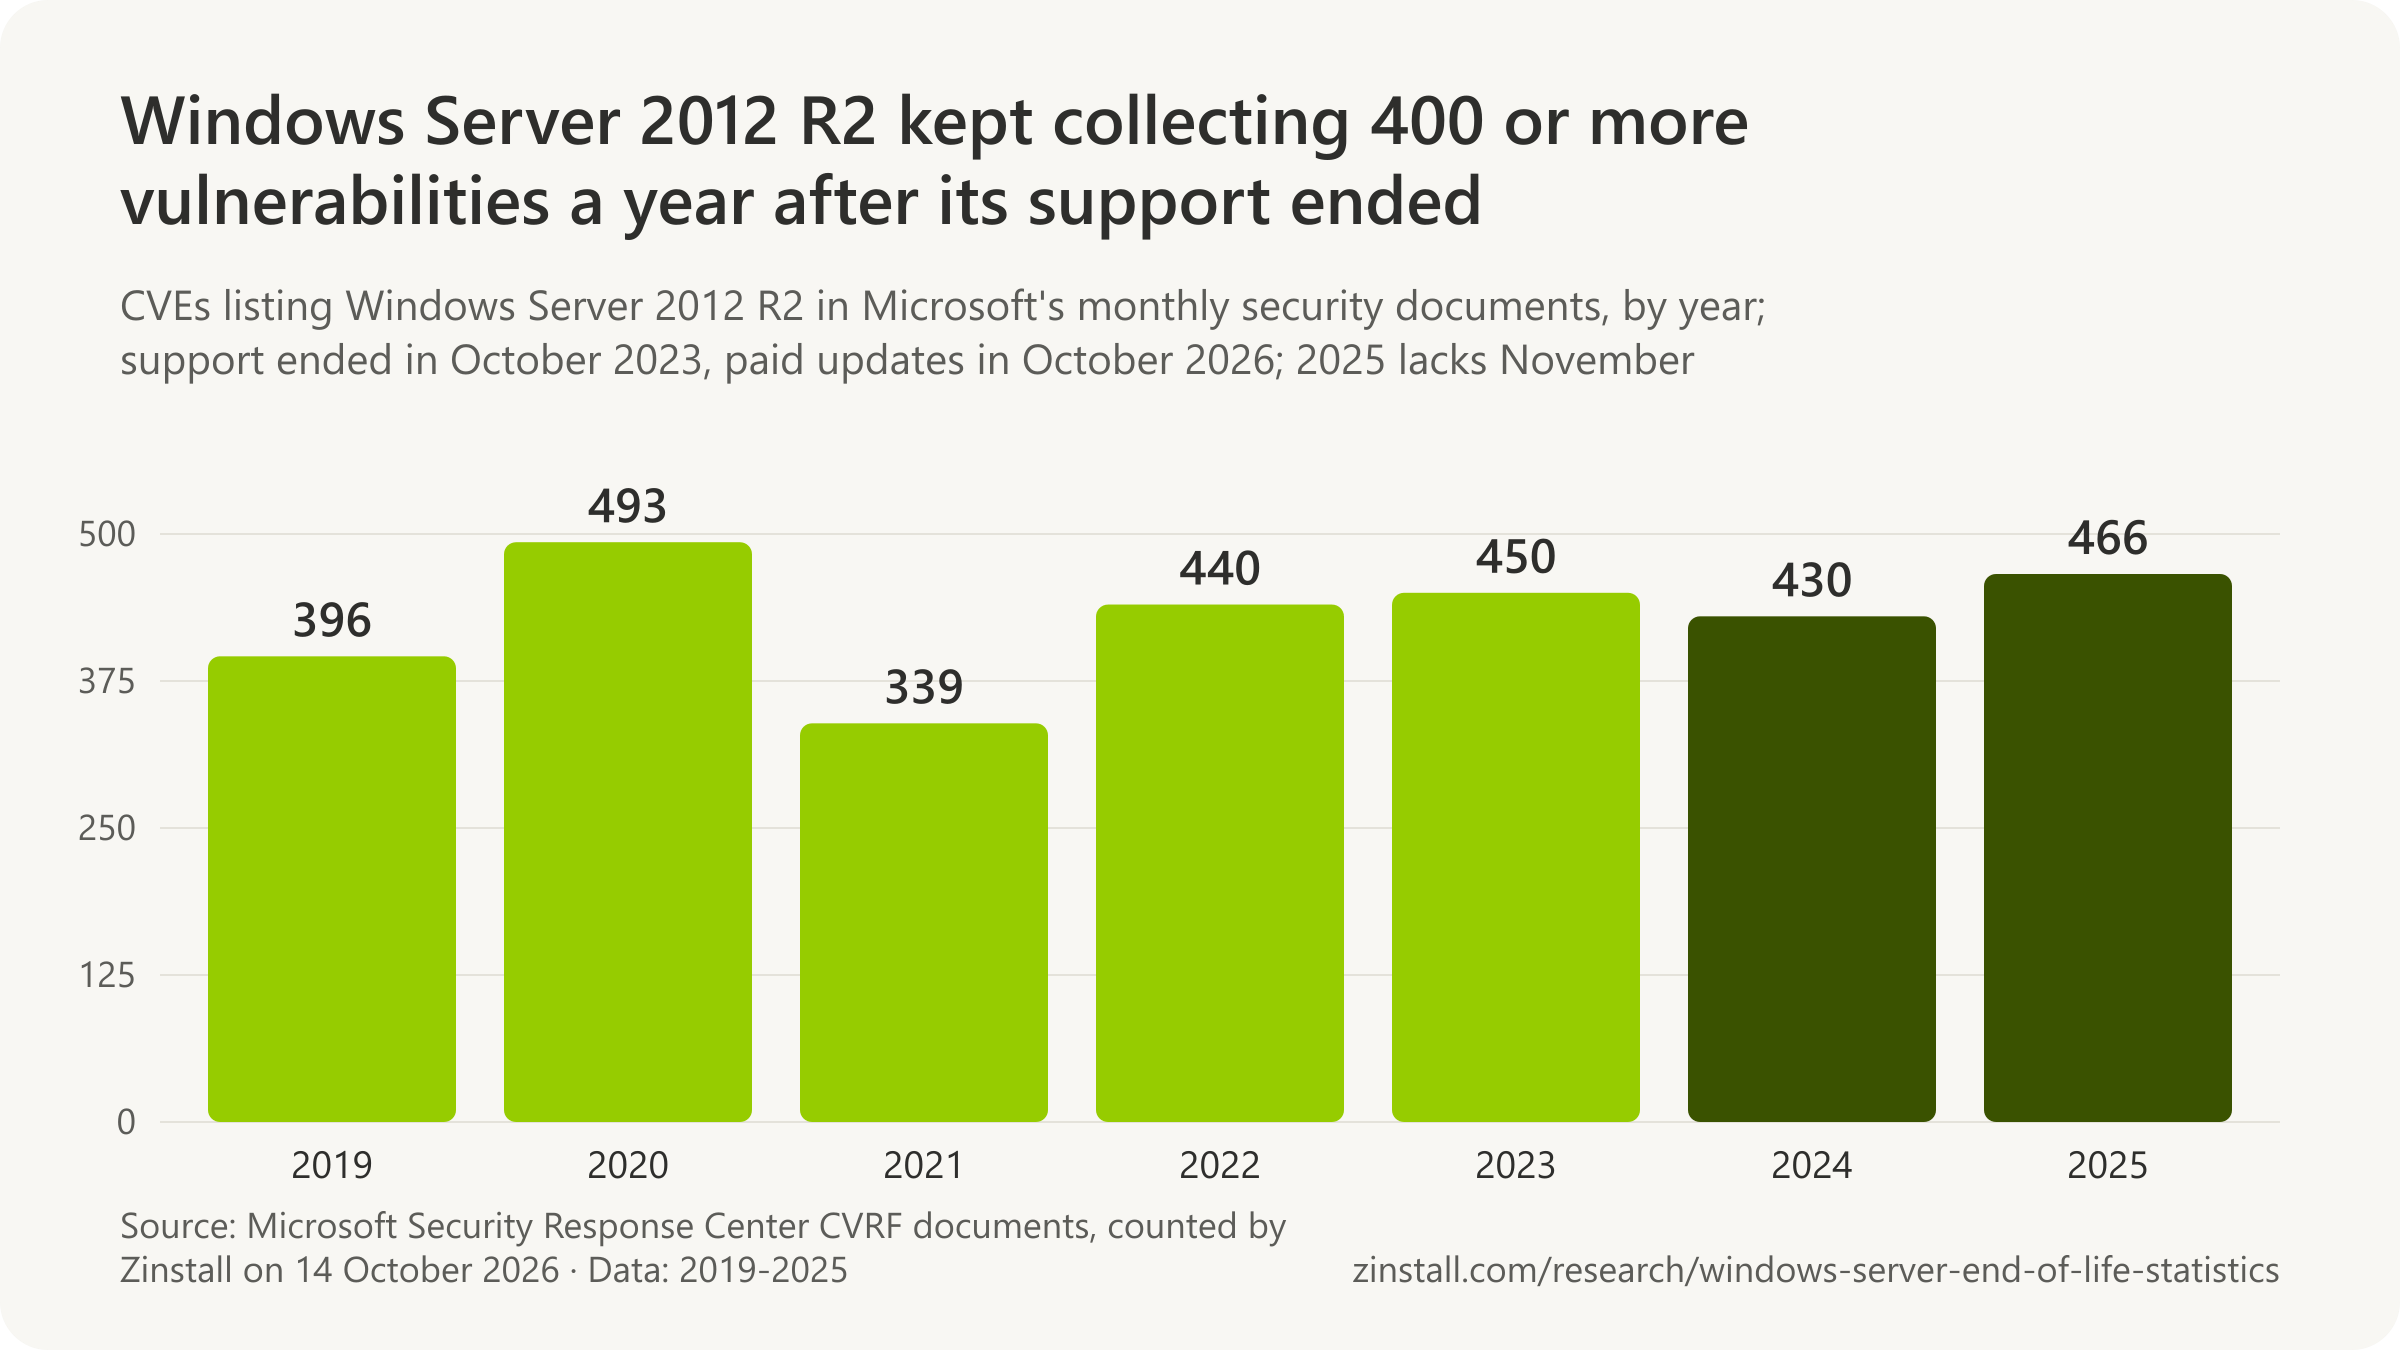
- Microsoft's 2024 security updates listed 430 vulnerabilities affecting Windows Server 2012 R2, in its first paid year.
- Scanners saw 511,000 internet-facing web servers on end-of-life IIS versions in March 2026.
- The UK regulator fined Interserve £4.4 million in 2022 over a breach involving Windows Server 2003 R2 and 2008 R2 servers.
- Insured businesses that kept end-of-life software were 3 times more likely to suffer a cyber incident, Coalition found in 2023.
- 14% of the networks Microsoft's incident responders examined in 2023 ran legacy or unsupported operating systems.
| Entries | Count |
|---|---|
| All entries in the catalogue | 1,741 |
| Microsoft entries | 390 (22.4%) |
| Microsoft entries naming Windows | 181 |
| Entries naming Windows Server | 3 |
| Entries affecting Windows Server 2012 R2 (joined with Microsoft's advisories) | 132 |
| Entries affecting Windows Server 2016 | 150 |
| Entries affecting Windows Server 2019 | 168 |
Sources: Cybersecurity and Infrastructure Security Agency; Microsoft Security Response Center (2025, 2024, 2023); The Shadowserver Foundation; Information Commissioner's Office; Coalition; Microsoft
More statistics (85)
49 actively exploited Microsoft vulnerabilities affecting Windows Server 2012 R2 were added to CISA's Known Exploited Vulnerabilities catalogue between 11 October 2023 and 13 October 2026, the version's three paid ESU years, 4 of them known to be used by ransomware (CISA and Microsoft MSRC, counted 2026).
An unsupported server keeps working. What changes is that newly found flaws are fixed in the supported versions and not in it, that scanners can see which versions are listening on the internet, and that the agencies which track exploited vulnerabilities keep adding entries that apply to it. The counts below are associations and tallies, not advice.
| Version and period | CVEs | Scope |
|---|---|---|
| Windows Server 2008 R2, 2019 (its last full supported year) | 385 | Security vulnerabilities (CVE ids) in Microsoft's monthly security update documents whose affected products include Windows Server 2008 R2 · Worldwide (all customers of the product) · 2019 |
| Windows Server 2008 R2, January 2026 (last document to list it) | 28 | Security vulnerabilities (CVE ids) in Microsoft's monthly security update documents whose affected products include Windows Server 2008 R2 · Worldwide (all customers of the product) · 2026-01 |
| Windows Server 2012 R2, 2023 | 450 | Security vulnerabilities (CVE ids) in Microsoft's monthly security update documents whose affected products include Windows Server 2012 R2 · Worldwide (all customers of the product) · 2023 |
| Windows Server 2012 R2, January to October 2023 (last supported months) | 413 | Security vulnerabilities (CVE ids) in Microsoft's monthly security update documents whose affected products include Windows Server 2012 R2 · Worldwide (all customers of the product) · 2023-01/2023-10 |
| Windows Server 2012 R2, 2024 (first ESU year) | 430 | Security vulnerabilities (CVE ids) in Microsoft's monthly security update documents whose affected products include Windows Server 2012 R2 · Worldwide (all customers of the product) · 2024 |
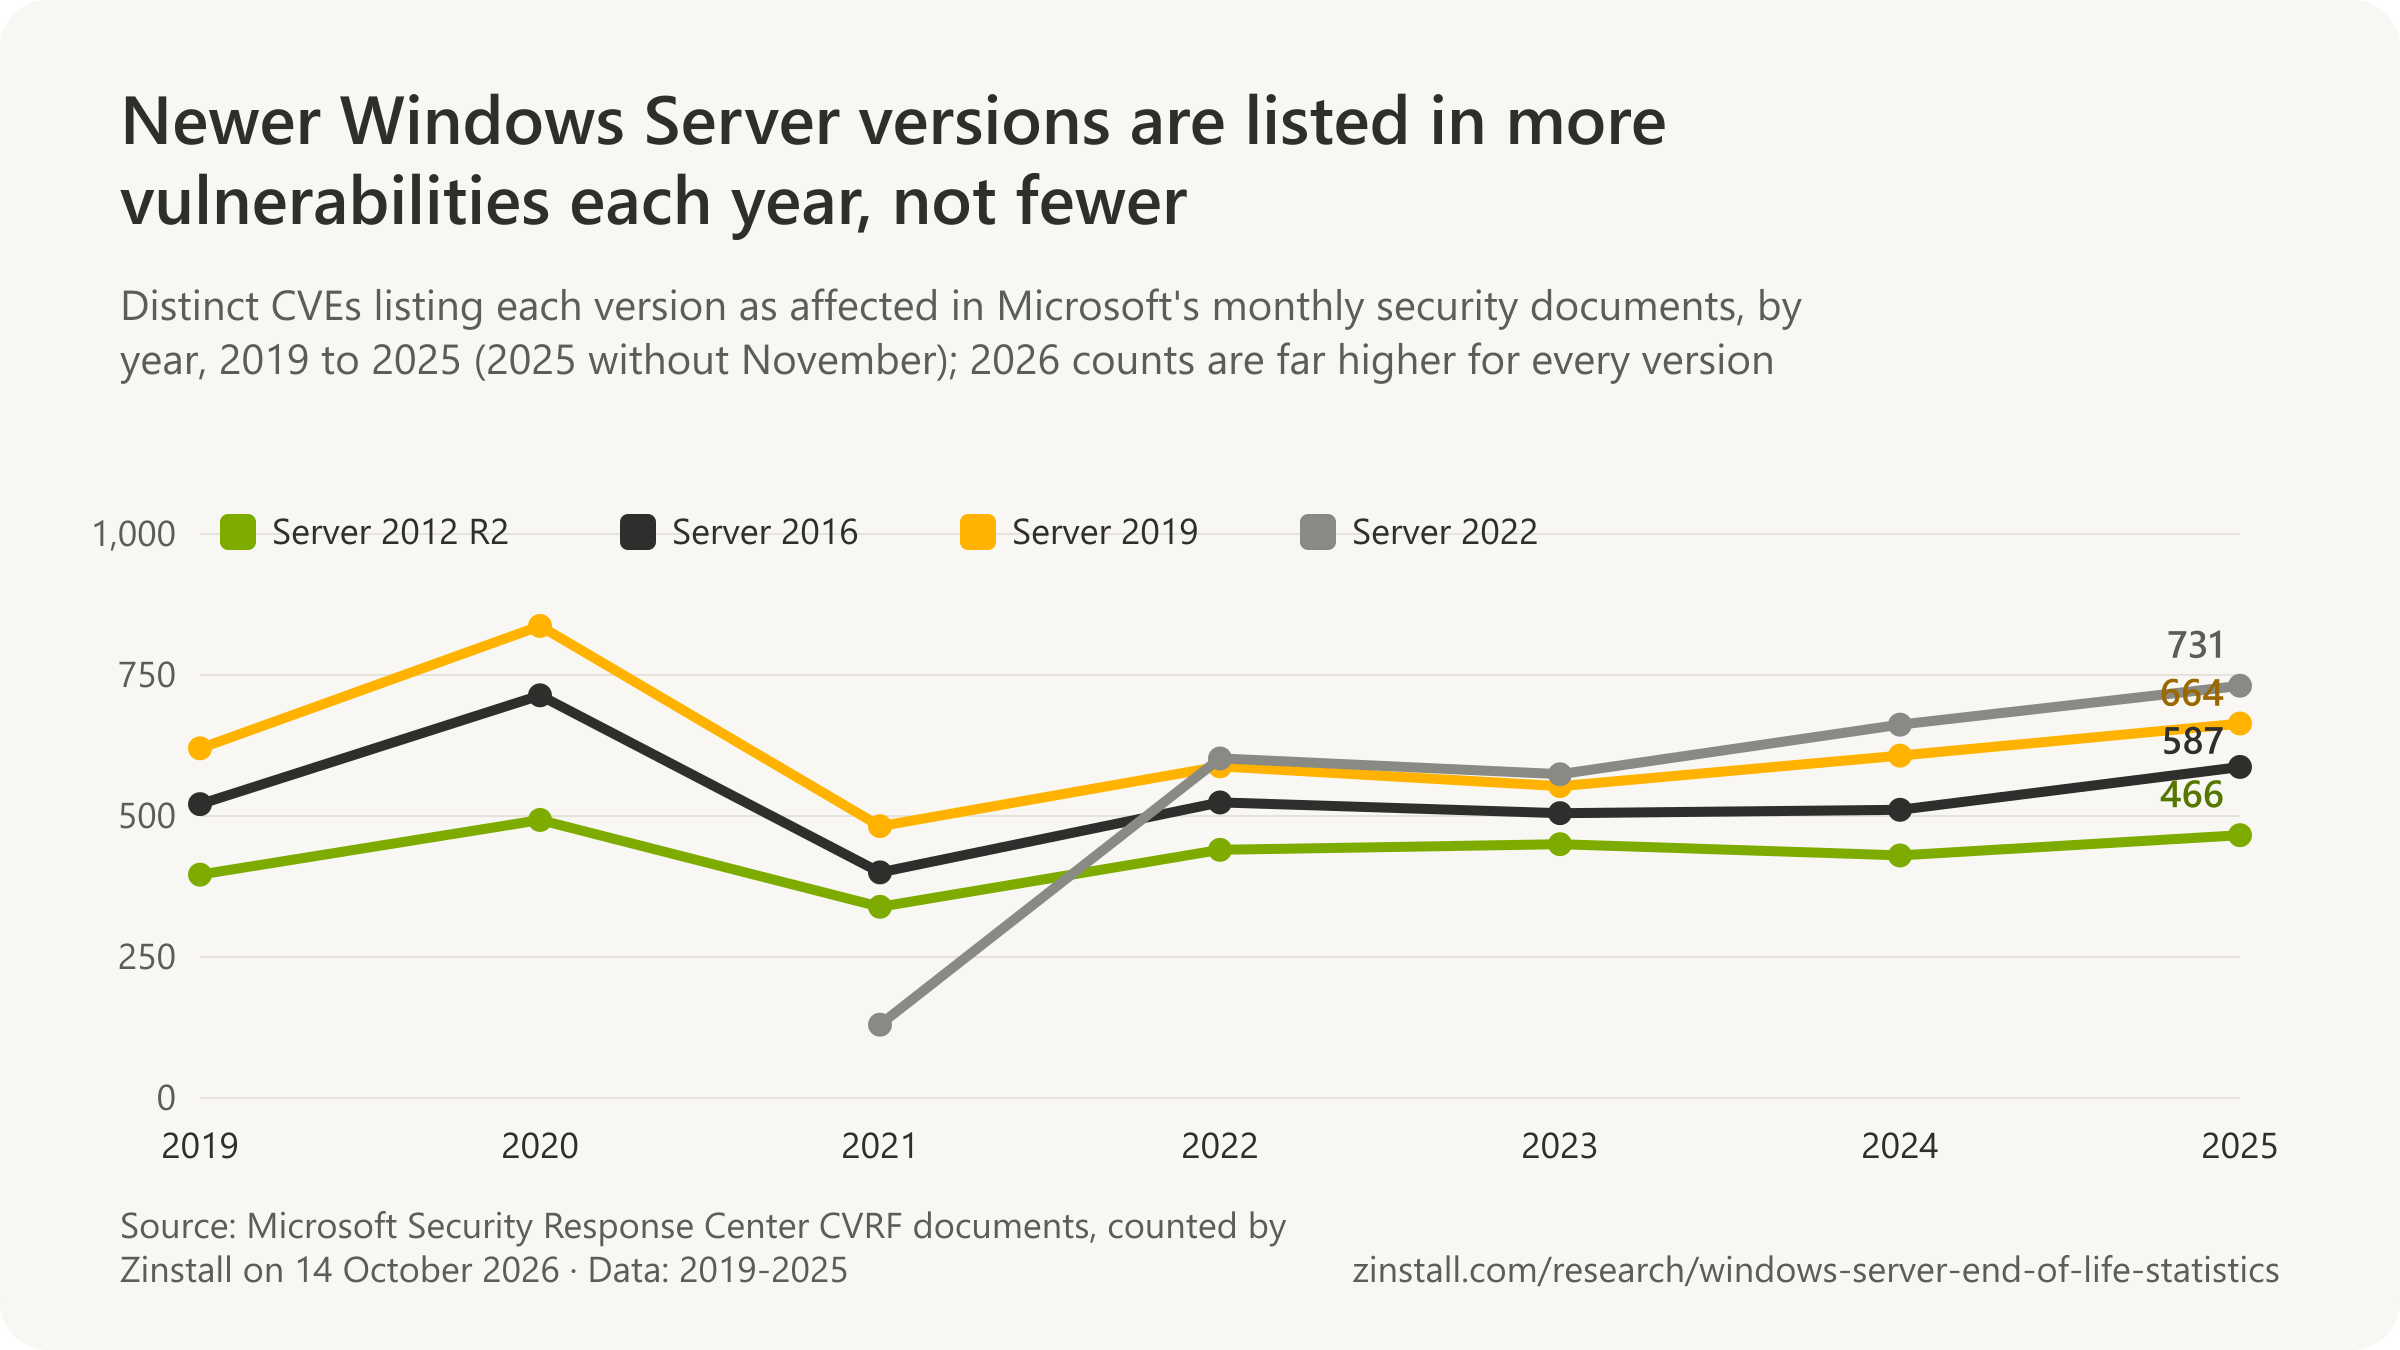
| Windows Server 2012 R2, 2025 (without November) | 466 | Security vulnerabilities (CVE ids) in Microsoft's monthly security update documents whose affected products include Windows Server 2012 R2 · Worldwide (all customers of the product) · 2025 |
| Windows Server 2012 R2, January to October 2026 | 1,693 | Security vulnerabilities (CVE ids) in Microsoft's monthly security update documents whose affected products include Windows Server 2012 R2 · Worldwide (all customers of the product) · 2026-01/2026-10 |
| Windows Server 2012 R2, October 2026 (final ESU update) | 673 | Security vulnerabilities (CVE ids) in Microsoft's monthly security update documents whose affected products include Windows Server 2012 R2 · Worldwide (all customers of the product) · 2026-10 |
| Windows Server 2012 R2, the three ESU years | 2,626 | Security vulnerabilities (CVE ids) in Microsoft's monthly security update documents whose affected products include Windows Server 2012 R2 · Worldwide (all customers of the product) · 2023-11/2026-10 |
| Windows Server 2012 R2, Critical, January to October 2026 | 120 | Security vulnerabilities (CVE ids) in Microsoft's monthly security update documents whose affected products include Windows Server 2012 R2 · Worldwide (all customers of the product) · 2026-01/2026-10 |
| Windows Server 2016, 2025 (without November) | 587 | Security vulnerabilities (CVE ids) in Microsoft's monthly security update documents whose affected products include Windows Server 2016 · Worldwide (all customers of the product) · 2025 |
| Windows Server 2016, January to October 2026 | 2,076 | Security vulnerabilities (CVE ids) in Microsoft's monthly security update documents whose affected products include Windows Server 2016 · Worldwide (all customers of the product) · 2026-01/2026-10 |
| Windows Server 2019, 2025 (without November) | 664 | Security vulnerabilities (CVE ids) in Microsoft's monthly security update documents whose affected products include Windows Server 2019 · Worldwide (all customers of the product) · 2025 |
| Windows Server 2019, January to October 2026 | 2,451 | Security vulnerabilities (CVE ids) in Microsoft's monthly security update documents whose affected products include Windows Server 2019 · Worldwide (all customers of the product) · 2026-01/2026-10 |
| Windows Server 2022, 2025 (without November) | 731 | Security vulnerabilities (CVE ids) in Microsoft's monthly security update documents whose affected products include Windows Server 2022 · Worldwide (all customers of the product) · 2025 |
| Windows Server 2022, January to October 2026 | 2,624 | Security vulnerabilities (CVE ids) in Microsoft's monthly security update documents whose affected products include Windows Server 2022 · Worldwide (all customers of the product) · 2026-01/2026-10 |
| Windows Server 2025, 2025 (without November) | 755 | Security vulnerabilities (CVE ids) in Microsoft's monthly security update documents whose affected products include Windows Server 2025 · Worldwide (all customers of the product) · 2025 |
| Windows Server 2025, January to October 2026 | 2,815 | Security vulnerabilities (CVE ids) in Microsoft's monthly security update documents whose affected products include Windows Server 2025 · Worldwide (all customers of the product) · 2026-01/2026-10 |
| All Microsoft products, January to October 2026 | 12,276 | All vulnerabilities (CVE ids) in Microsoft's monthly CVRF documents, any product, any issuing CNA · Worldwide (all customers of the product) · 2026-01/2026-10 |

| Measure | Entries | Scope |
|---|---|---|
| All entries in the catalogue | 1,741 | Vulnerabilities CISA has evidence of active exploitation for · Worldwide (catalogue maintained by the US CISA) · 2026-10-13 |
| Microsoft entries | 390 (22.4%) | KEV catalogue entries · Worldwide (catalogue maintained by the US CISA) · 2026-10-13 |
| Microsoft entries naming Windows | 181 | KEV catalogue entries with vendor Microsoft · Worldwide (catalogue maintained by the US CISA) · 2026-10-13 |
| Entries naming Windows Server | 3 | KEV catalogue entries with vendor Microsoft · Worldwide (catalogue maintained by the US CISA) · 2026-10-13 |
| Entries affecting Windows Server 2012 R2 (joined with Microsoft's advisories) | 132 | KEV catalogue entries with vendor Microsoft and a 2019-2026 MSRC CVRF record · Worldwide (catalogue maintained by the US CISA) · 2026-10-13 |
| Added during Windows Server 2012 R2's ESU years | 49 | KEV catalogue entries with vendor Microsoft whose MSRC advisory lists Windows Server 2012 R2 · Worldwide (catalogue maintained by the US CISA) · 2023-10-11/2026-10-13 |
| Entries affecting Windows Server 2016 | 150 | KEV catalogue entries with vendor Microsoft and a 2019-2026 MSRC CVRF record · Worldwide (catalogue maintained by the US CISA) · 2026-10-13 |
| Entries affecting Windows Server 2019 | 168 | KEV catalogue entries with vendor Microsoft and a 2019-2026 MSRC CVRF record · Worldwide (catalogue maintained by the US CISA) · 2026-10-13 |
Exposed on the internet
| Scan, date and measure | Count or share | Scope |
|---|---|---|
| Shadowserver, March 2026: IIS servers on end-of-life IIS versions | 511,000+ | Internet-reachable HTTP services identifying as Microsoft IIS in Shadowserver's daily scans · Worldwide (IPv4 and IPv6 hosts scanned daily by Shadowserver) · 2026-03 |
| Shadowserver, March 2026: on the IIS releases of Windows Server 2012 and 2012 R2 (derived) | ~284,000 | Internet-reachable HTTP services identifying as Microsoft IIS in Shadowserver's daily scans · Worldwide (IPv4 and IPv6 hosts scanned daily by Shadowserver) · 2026-03 |
| Shadowserver, March 2026: on IIS releases beyond ESU (2008 R2 or older) | 227,000+ | Internet-reachable HTTP services identifying as Microsoft IIS in Shadowserver's daily scans · Worldwide (IPv4 and IPv6 hosts scanned daily by Shadowserver) · 2026-03 |
| Bangladesh national CIRT, March 2026: IP addresses with end-of-life IIS | 452 | Internet-facing IP addresses in Bangladesh running end-of-life IIS · Bangladesh · 2026-03-23 |
| Shadowserver via TechRadar, December 2023: end-of-life Exchange servers | ~20,000 | Internet-connected Microsoft Exchange servers seen in Shadowserver scans · Worldwide (more than half in Europe, about 6,000 in the US) · 2023-12 |
| Cybernews via Shodan, September 2021: web servers on unsupported IIS | 2 million+ | Internet-facing web servers announcing a legacy Microsoft IIS version in Shodan, honeypots excluded · Worldwide (Shodan search results) · 2021-09 |
| Cybernews via Shodan, September 2021: IIS 7.5 (Windows Server 2008 R2) | 1,376,216 | Internet-facing web servers announcing a legacy Microsoft IIS version in Shodan, honeypots excluded · Worldwide (Shodan search results) · 2021-09 |
| Rapid7, 2020: Windows Server nodes exposing SMB | 298,296 | Internet-exposed SMB services found by Project Sonar in 2020 · Worldwide (Rapid7 Project Sonar) · 2020 |
| Bitsight, July 2019: exposed systems vulnerable to BlueKeep | 788,214 | Internet-exposed RDP systems vulnerable to BlueKeep (CVE-2019-0708): Windows XP, 7, Server 2003, 2008 and 2008 R2 · Worldwide (Bitsight internet scans) · 2019-07-23 |
| Bitsight, July 2019: still unpatched ten weeks after the fix | 81% | Internet-exposed RDP systems vulnerable to BlueKeep (CVE-2019-0708): Windows XP, 7, Server 2003, 2008 and 2008 R2 · Worldwide (Bitsight internet scans) · 2019-05-31/2019-07-23 |
| Shodan, June 2017: SMB services still vulnerable to WannaCry's flaw | 91,081 | SMB services visible to Shodan on the internet · Worldwide (Shodan crawlers) · 2017-06-15 |
| Rapid7, May 2017: Windows devices exposing SMB | 800,000+ | Internet-connected devices exposing SMB on TCP 445, fingerprinted by Rapid7 recog · Worldwide (Rapid7 Project Sonar) · 2017-05 |
Infections, incidents and penalties
| Version | Computers cleaned per 1,000 |
|---|---|
| Windows Server 2003 SP2 | 6.5 per 1,000 |
| Windows Server 2008 SP2 | 3.7 per 1,000 |
| Windows Server 2008 R2 SP1 | 2.5 per 1,000 |
| Windows Server 2012 | 1.2 per 1,000 |
| Windows Server 2012 R2 | 0.5 per 1,000 |
- 98% of documented WannaCry infections ran Windows 7, with Windows Server 2008 R2 the second most hit version, according to Kaspersky Lab figures reported in May 2017, contrary to the belief that Windows XP was to blame (BleepingComputer, 2017).
- 98.4% of the WannaCry detections Kaspersky logged in May 2017 were on Windows 7, with Windows Server 2008 the other platform hit and Windows XP almost absent (Kaspersky via Computerworld, 2017).
- Microsoft released its WannaCrypt (MS17-010) security update for Windows Server 2003, Windows XP and Windows 8 to all customers on 13 May 2017, almost two years after Server 2003's end of support, because of the attack's scale (Microsoft, 2017).
- Microsoft shipped a fix for the wormable BlueKeep flaw (CVE-2019-0708) to out-of-support Windows Server 2003 and XP on 14 May 2019, while saying the best answer for those systems was to upgrade (Microsoft, 2019).
- US-CERT warned on 30 March 2017 of active exploitation of an IIS 6.0 vulnerability in Windows Server 2003 (CVE-2017-7269), a version out of support since July 2015 (CISA, 2017).
- 14% of the customer environments Microsoft Incident Response reviewed in its 2023 engagements ran legacy or unsupported operating systems, and 43% had missing or inconsistent update management (Microsoft Digital Defense Report, 2023).
- 43% of the customer environments Microsoft Incident Response reviewed in its 2023 engagements had missing or inconsistent update management (Microsoft Digital Defense Report, 2023).
- 80% to 90% of all successful ransomware compromises originated through unmanaged devices in Microsoft's observations for its 2023 Digital Defense Report (Microsoft, 2023).
- 25% of operational technology devices on Microsoft customers' networks used unsupported operating systems, Microsoft's 2023 Digital Defense Report found (Microsoft, 2023).
- 90%+ of the human-operated ransomware attacks that reached the ransom stage had used unmanaged devices on the victim's network, for initial access or to encrypt remotely, Microsoft's 2024 Digital Defense Report found (Microsoft, 2024).
- Security incidents handled by Microsoft Incident Response in January to March 2024 were more prevalent on domain controllers running older Windows Server versions (2016 and 2019) than on 2022, Microsoft's 2024 Digital Defense Report found (Microsoft, 2024).
- 18% of breaches in Microsoft's incident response investigations were initiated via unpatched web assets and 12% via exposed remote services, against 28% via phishing or social engineering, Microsoft's 2025 Digital Defense Report found (Microsoft, 2025).
- 90%+ of successful ransomware attacks exploit unmanaged endpoints 'with unsupported OS versions creating attack vectors', Microsoft's September 2025 business page says, citing the 2024 Digital Defense Report, which ties the figure to unmanaged devices only (Microsoft, 2025).
- 3 times more likely to suffer a cyber incident were Coalition policyholders that kept using end-of-life software, the insurer's 2023 Cyber Claims Report found (Coalition, 2023).
- Microsoft's own Teams directory endpoint was still serving end-of-life IIS 8.5, the Windows Server 2012 R2 web server, in December 2023, two months after end of support, the insurer Coalition found while scanning policyholders (Coalition, 2023).
- Windows Server 2012 accounted for about 14% of all Windows Server alerts in ConnectWise's SIEM data, Redmond Channel Partner wrote in April 2024, framing it as SMBs 'still running Windows Server 2012' (Redmond Channel Partner, 2024).
| Case | Figure | Scope |
|---|---|---|
| Interserve (UK ICO, 2022): servers on Windows Server 2003 R2 | 18 | Interserve Group servers processing personal data (HR and pensions systems) · United Kingdom · 2020 |
| Interserve: servers on Windows Server 2008 R2 | 22 | Interserve Group servers processing personal data (HR and pensions systems) · United Kingdom · 2020 |
| Interserve: penalty | £4.4 million | Interserve Group Limited (one case) · United Kingdom · 2022-10 |
| Cathay Pacific (UK ICO, 2020): penalty | £500,000 | Cathay Pacific Airways Limited (one case) · United Kingdom (and 9.4 million customers worldwide) · 2014-10/2018-05 |
| Anchorage Community Mental Health Services (US HHS, 2014): settlement | $150,000 | Anchorage Community Mental Health Services (one case, 2,743 individuals affected) · United States (Alaska) · 2014-12 |
What agencies and standards say
- Windows Server 2012 and 2012 R2 stopped receiving security updates, non-security updates, bug fixes, technical support and online technical content updates after 10 October 2023, unless covered by ESU, Microsoft's end-of-support notice states (Microsoft, 2023).
- CISA listed the use of unsupported or end-of-life software as the first entry in its Bad Practices catalogue in 2021, calling it dangerous for critical infrastructure and 'especially egregious' in internet-accessible technologies (CISA, 2021).
- The UK's National Cyber Security Centre says the only fully effective way to manage the risk of an obsolete product is to stop using it, and that obsolete servers should be treated as untrusted (NCSC, 2021).
- ENISA advised in January 2014 that discontinued software should be considered a high security risk for critical IT components and mitigated by migrating, warning it may stay exposed to each new vulnerability 'forever' (ENISA, 2014).
- Germany's BSI requires, as a basic IT-Grundschutz control (OPS.1.1.3.A15, 2023 edition), that hardware or software no longer supported by its maker be used only if checked to run securely, and otherwise not used at all (BSI, 2023).
- The PCI Security Standards Council's FAQ 1130 (June 2013) says systems on an operating system its vendor no longer supports cannot meet the PCI DSS patching requirements, so they need compensating controls and an active migration plan (PCI SSC, 2013).
- An internet-facing server on an unsupported operating system is reported as an automatic failure in a PCI DSS approved scanning vendor (ASV) scan, the PCI Security Standards Council's FAQ 1130 states (PCI SSC, 2013).
- CISA warned in October 2019 that organisations running Windows 7 and Windows Server 2008 R2 after 14 January 2020 might be unable to satisfy regulatory compliance requirements and faced a higher likelihood of malware (CISA, 2019).
- Canada's Cyber Centre told organisations in March 2019 to begin migrating off Windows Server 2008 and 2008 R2 before 14 January 2020, saying ESU would cover only vulnerabilities Microsoft rated critical (Canadian Centre for Cyber Security, 2019).
Counts that circulate
| Site, version and measure | Figure | Scope |
|---|---|---|
| stack.watch: Windows Server 2012, 2026 to 14 October | 1,515 (2025: 467) | CVEs that stack.watch maps to Microsoft Windows Server 2012 · Worldwide · 2026-01 to 2026-10 |
| stack.watch: Windows Server 2016, 2026 to 14 October | 1,977 (2025: 601) | CVEs that stack.watch maps to Microsoft Windows Server 2016 · Worldwide · 2026-01 to 2026-10 |
| cvefeed.io: Windows Server 2012, all time | 5,714 CVEs; 211 in CISA KEV | CVEs that cvefeed.io maps to the product 'Windows Server 2012' · Worldwide · 2026-10 |
| OpenCVE: Windows Server 2012, all time | 5,705 CVEs; 209 in KEV | CVEs whose CPE configuration includes microsoft:windows_server_2012 (OpenCVE) · Worldwide · 2026-10 |
| OpenCVE: Windows Server 2016, all time | 7,018 CVEs; 188 in KEV | CVEs whose CPE configuration includes microsoft:windows_server_2016 (OpenCVE) · Worldwide · 2026-10 |
| CVEdetails: Windows Server 2012, March 2025 capture | 3,315 | CVEs that CVEdetails maps to Microsoft Windows Server 2012 · Worldwide · 2025-03 |
| endoflife.ai: times Windows Server appears in CISA's catalogue | 1 (catalogue: 3 by name, 178 'Windows') | CISA KEV catalogue entries (endoflife.ai's product match) · Worldwide · 2026-10 |
| Morphisec: Windows Server 2012 CVEs by end of support (unsourced) | over 1,000 | CVEs affecting Windows Server 2012 and 2012 R2 (unspecified count method) · Worldwide · 2023-10 |
- 'Around 10 percent of all servers in use today' run an out-of-support Windows version such as 2008 or 2012, Morphisec wrote in October 2024, citing only 'available market share data' (Morphisec, 2024).
- 75% of organisations that do not complete their migration from Windows Server 2012 will suffer a security breach or data loss by 2026, Red Piranha's blog attributes to Gartner, without naming or linking the Gartner note (Red Piranha, 2023).
Sources: Cybersecurity and Infrastructure Security Agency (2017-2026); Microsoft Security Response Center (2017-2026); The Shadowserver Foundation; Bangladesh e-Government Computer Incident Response Team; TechRadar; Cybernews; Rapid7 (2017, 2020); Bitsight; Shodan; Microsoft (2015-2025); BleepingComputer; Computerworld; Coalition (2023); Channel Futures; Redmond Channel Partner; Information Commissioner's Office (2020, 2022); US Department of Health and Human Services; National Cyber Security Centre; European Union Agency for Network and Information Security; Bundesamt für Sicherheit in der Informationstechnik; PCI Security Standards Council; Canadian Centre for Cyber Security; stack.watch (2026); cvefeed.io; OpenCVE (2026); CVEdetails; endoflife.ai; Morphisec; Red Piranha
How much do Windows Server Extended Security Updates cost?
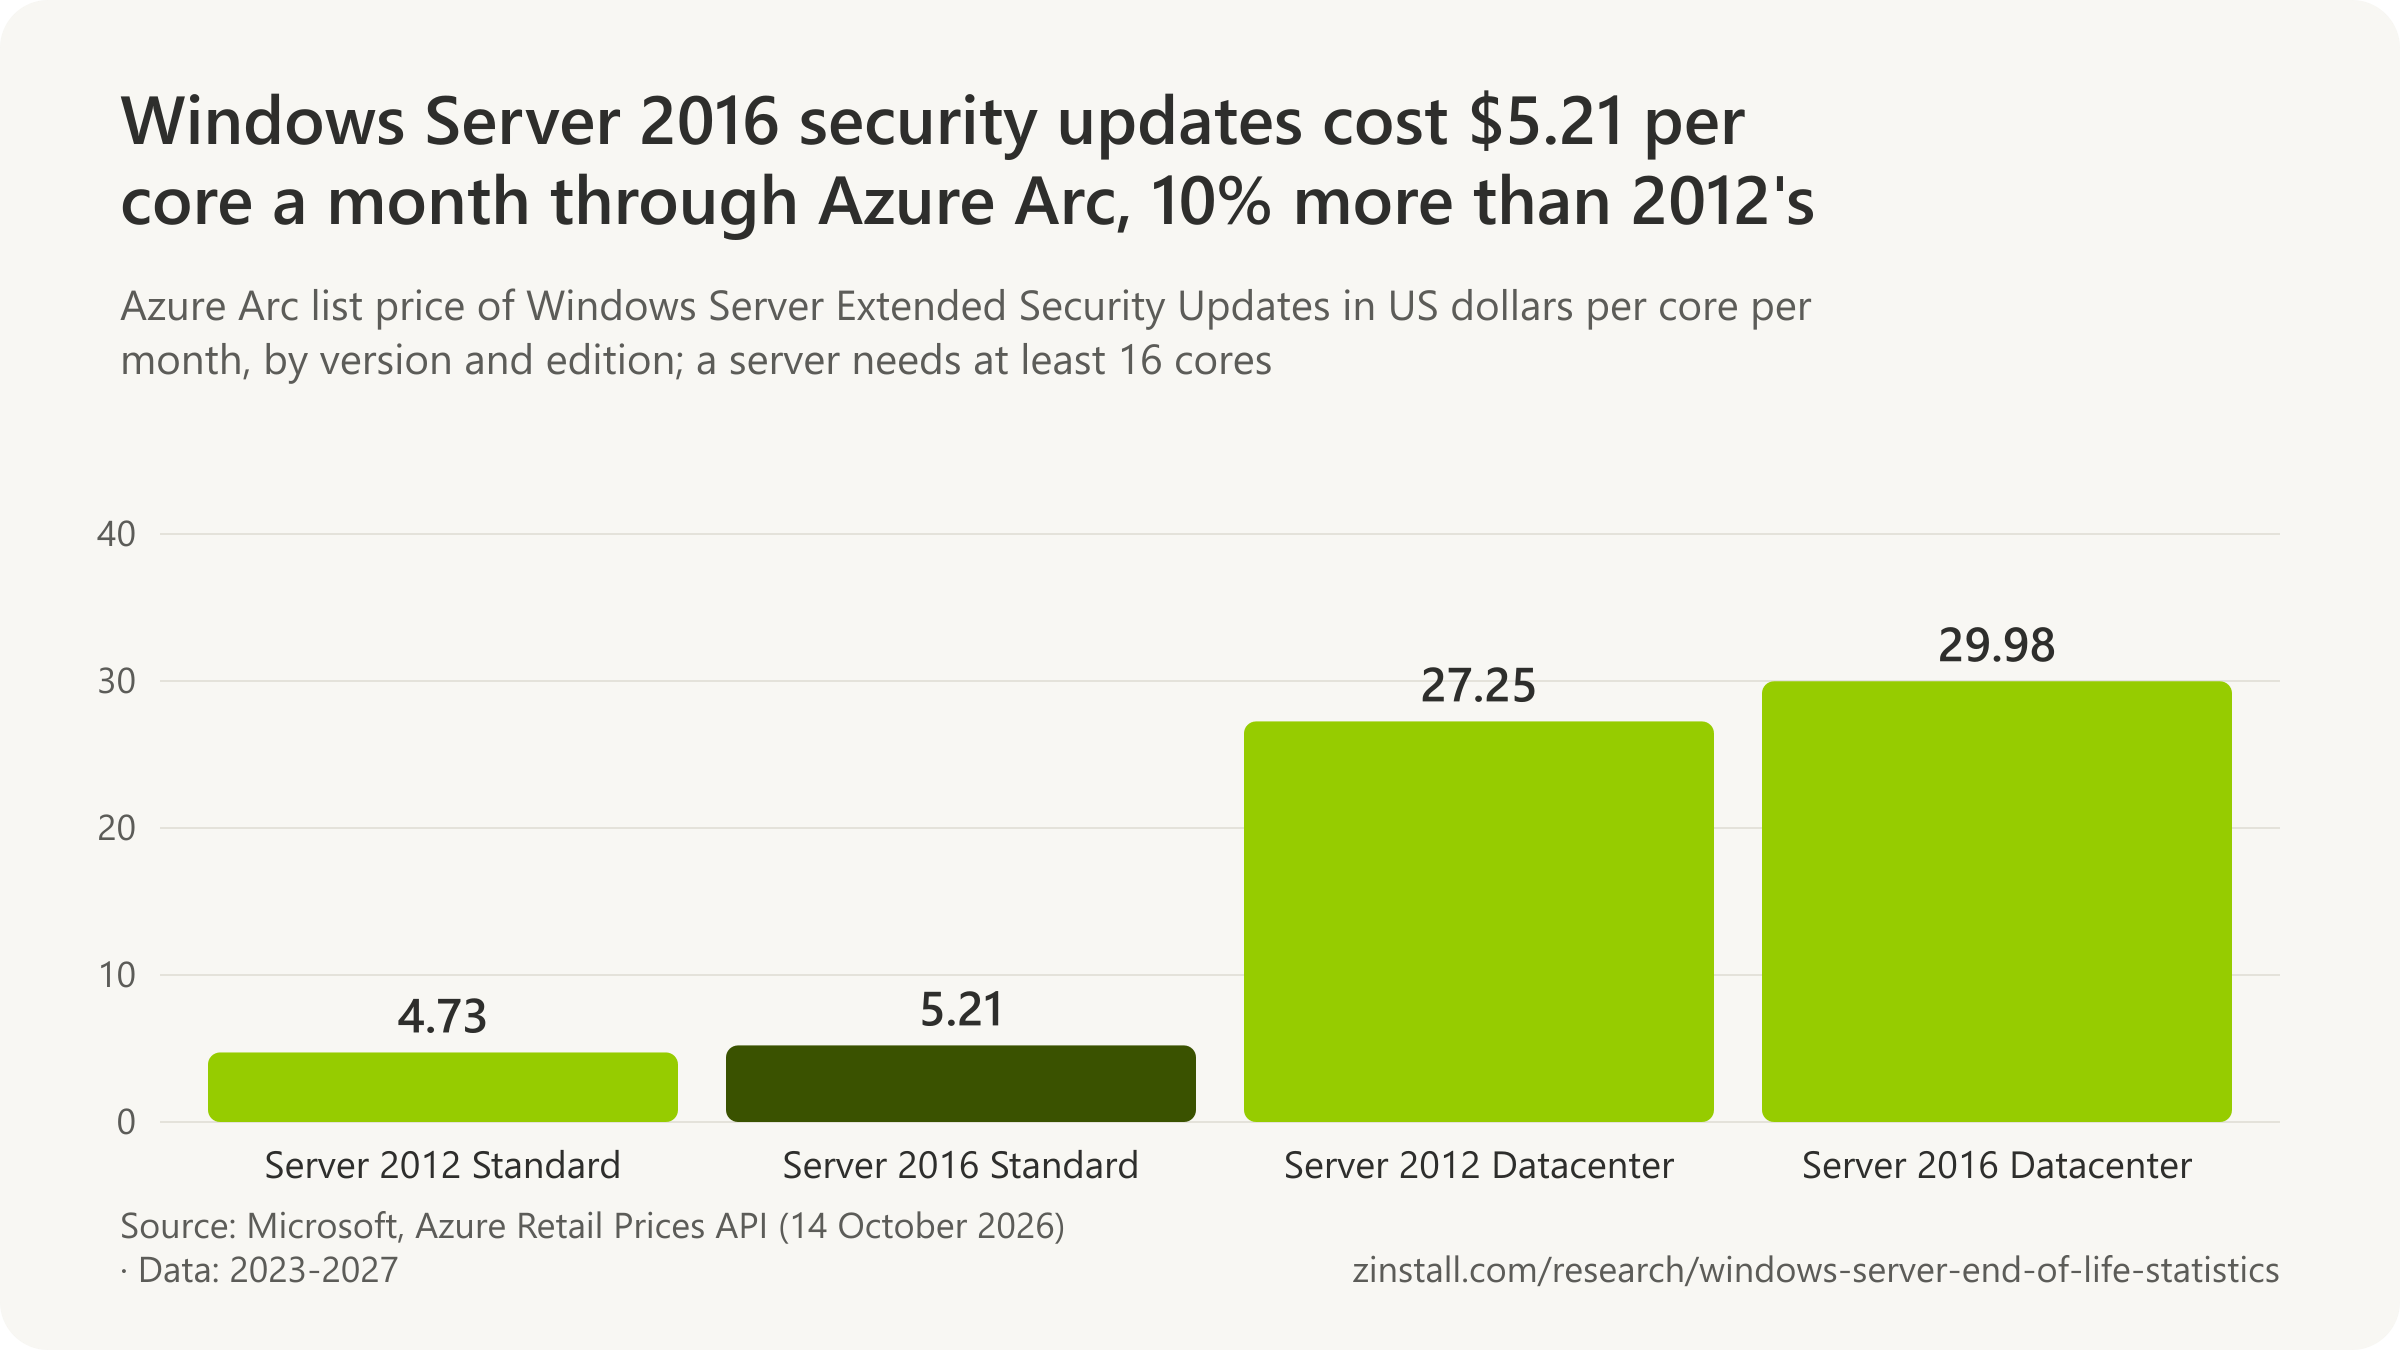
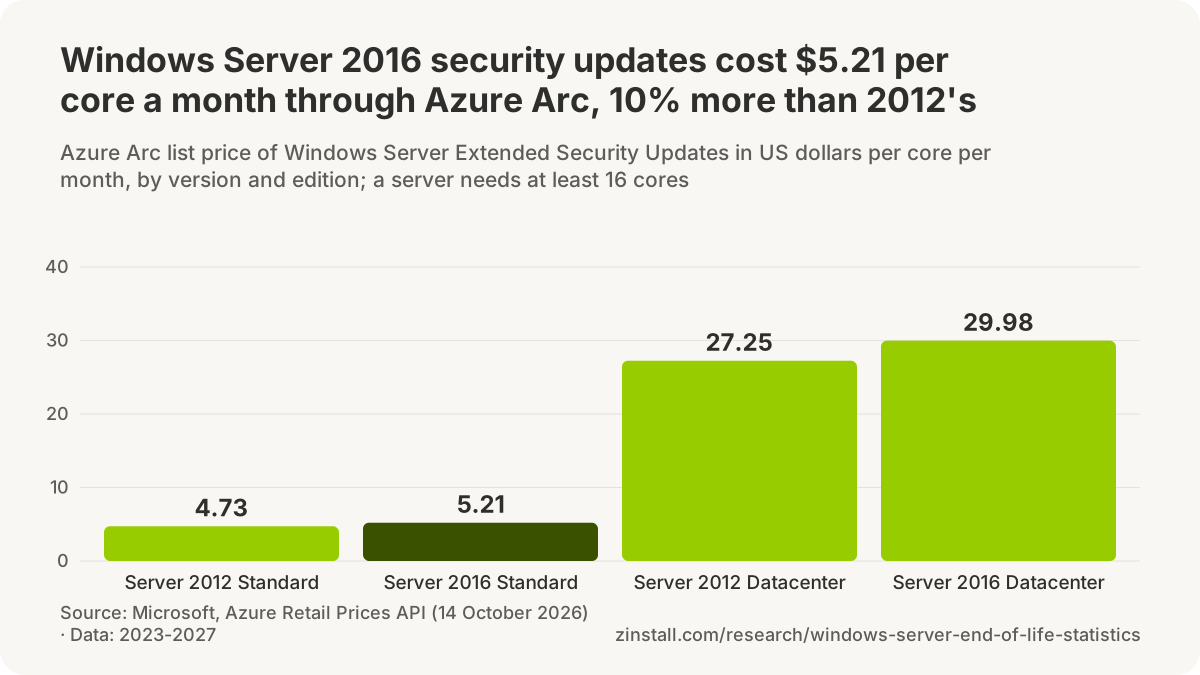
Windows Server 2016 security updates cost $5.21 per core a month through Azure Arc, $2,999 over three years for 16 cores (Microsoft, 2026).

- For a 16-core Datacenter server, three years of updates cost $17,268 at list price.
- Azure Arc bills at least 16 cores per physical server and 8 per virtual machine.
- Hotpatching for Windows Server 2025, launched at $1.50 per core a month, has been free since 15 May 2026.
- Microsoft put custom support for Windows Server 2003 after its end at $200,000 or more a year.
| Programme and date | Share of the licence price |
|---|---|
| Windows Server and SQL Server 2008, as announced in July 2018 | 75% |
| Windows Server and SQL Server 2008, August 2019 | about 75% per year |
| Windows Server 2012, first published (November 2021) | 75%, 100%, 125% |
| Windows Server 2012, by 9 October 2023 | 100% each year |
| Windows Server 2012, Microsoft's lifecycle FAQ in 2026 | 100% per year |
| Windows Server 2012, three years under either schedule | 300% over 3 years |
| SQL Server ESU, 2026 | about 75% per year |
Sources: Microsoft (2018-2026); The Register
More statistics (46)
$5.21 per core per month is the Azure Arc list price of Windows Server 2016 Extended Security Updates for Standard edition, at Microsoft's $0.007132 per core-hour rate (Microsoft, 2026).
Microsoft sells security-only updates for a retired Windows Server for up to three years, at a price set as a share of the licence, with exceptions for servers that run in Azure or are connected to it through Azure Arc. The terms below are Microsoft's own; the worked examples are arithmetic on its published prices.
| Product and edition | Price | Scope |
|---|---|---|
| Windows Server 2012 ESU, Standard | $4.73 per core per month | Windows Server 2012 Standard cores enrolled in ESUs enabled by Azure Arc (list price, Global region) · Worldwide · 2023-09-01 |
| Windows Server 2012 ESU, Datacenter | $27.25 per core per month | Windows Server 2012 Datacenter cores enrolled in ESUs enabled by Azure Arc (list price, Global region) · Worldwide · 2023-09-01 |
| Windows Server 2016 ESU, Standard | $5.21 per core per month | Windows Server 2016 Standard cores enrolled in ESUs enabled by Azure Arc (list price, Global region) · Worldwide · 2026-08-01 |
| Windows Server 2016 ESU, Datacenter | $29.98 per core per month | Windows Server 2016 Datacenter cores enrolled in ESUs enabled by Azure Arc (list price, Global region) · Worldwide · 2026-08-01 |
| SQL Server 2016 ESU, Standard edition | $138.70 per core per month (Standard) | SQL Server 2016 cores enrolled in ESUs enabled by Azure Arc (list price, Global region) · Worldwide · 2026-04-01 |
| Windows Server licence, pay as you go through Azure Arc | $33.58 per core per month | Windows Server pay-as-you-go licences via Azure Arc (list price, USD) · Worldwide · 2026-10 |
| Version and edition | Three years | Scope |
|---|---|---|
| Windows Server 2012 Standard | $2,725 | A hypothetical 16-core Windows Server 2012 Standard server licensed on physical cores (worked example) · Worldwide · 2023-10 to 2026-10 |
| Windows Server 2016 Standard | $2,999 | A hypothetical 16-core Windows Server 2016 Standard server licensed on physical cores (worked example) · Worldwide · 2027-01 to 2030-01 |
| Windows Server 2016 Datacenter | $17,268 | A hypothetical 16-core Windows Server 2016 Datacenter server licensed on physical cores (worked example) · Worldwide · 2027-01 to 2030-01 |
| Programme and date | Share of the licence price | Scope |
|---|---|---|
| Windows Server and SQL Server 2008, as announced in July 2018 | 75% | Customers with active Software Assurance or subscription licences buying ESU for on-premises 2008 servers · Worldwide · 2018-07 |
| Windows Server and SQL Server 2008, August 2019 | about 75% per year | Microsoft's ESU pricing for Windows Server and SQL Server 2008 and 2008 R2 (marketing FAQ) · Worldwide · 2019-08 |
| Windows Server 2012, first published (November 2021) | 75%, 100%, 125% | Microsoft's announced ESU pricing for Windows Server 2012/2012 R2 and SQL Server 2012 (marketing FAQ) · Worldwide · 2021-11 |
| Windows Server 2012, by 9 October 2023 | 100% each year | Microsoft's ESU pricing for Windows Server 2012 and 2012 R2 (lifecycle FAQ) · Worldwide · 2023-10-09 |
| Windows Server 2012, Microsoft's lifecycle FAQ in 2026 | 100% per year | Microsoft's Extended Security Update terms for Windows Server 2012 and 2012 R2 (documentation) · Worldwide · 2023-10 to 2026-10 |
| Windows Server 2012, three years under either schedule | 300% over 3 years | Microsoft's ESU pricing for Windows Server 2012 and 2012 R2 · Worldwide · 2023-10 to 2026-10 |
| SQL Server ESU, 2026 | about 75% per year | Microsoft's SQL Server ESU terms (documentation) · Worldwide · 2026 |
| Product | Price | Scope |
|---|---|---|
| Windows Server 2016, 16 cores (Open NL reference) | $883 (Standard), $6,155 (Datacenter) | Windows Server 2016 Standard and Datacenter licences (reference price) · Worldwide · 2016-10 |
| Windows Server 2025 Standard, 16 cores | $1,176 | Windows Server 2025 Standard licence (suggested MSRP, USD) · Worldwide · 2026-10 |
| Windows Server 2025 Datacenter, 16 cores | $6,771 | Windows Server 2025 Datacenter licence (suggested MSRP, USD) · Worldwide · 2026-10 |
- No additional charge applies to Windows Server 2012 and 2012 R2 Extended Security Updates in Azure virtual machines, Dedicated Host, Azure VMware Solution, Nutanix Cloud Clusters on Azure and the Azure Stack portfolio, beyond the cost of running the machine (Microsoft, 2026).
- 3 years is the maximum ESU coverage after end of support for Windows Server 2012 and 2012 R2, limited to security updates rated Critical and Important (Microsoft, 2026).
- No new features, customer-requested non-security hotfixes, design changes or general technical support are included in Windows Server Extended Security Updates; support covers only ESU installation, activation and update regressions (Microsoft, 2026).
- Every earlier ESU year had to be bought to join Windows Server 2012 ESU late: Year 2 and Year 3 licences required the prior years' licences, and late Azure Arc sign-ups were back-billed for each missed month (Microsoft, 2026).
- 16 physical cores per server (or 8 virtual cores per virtual machine) is the minimum Windows Server 2012 ESU purchase through Azure Arc, matching Windows Server's core-licensing minimums (Microsoft, 2026).
- 3 routes qualified a server for Windows Server ESU outside Azure: active Software Assurance, an active subscription licence (including CSP), or a licence-included SPLA hosting service (Microsoft, 2026).
- Monthly billing through an Azure subscription, with no product keys, is how Azure Arc delivers Windows Server ESU, against yearly licences activated by Multiple Activation Keys through Commercial Licensing (Microsoft, 2026).
- No free disaster-recovery or Visual Studio dev/test coverage comes with Windows Server 2016 ESUs, two no-cost benefits that Windows Server 2012 ESUs included, so standby and test servers must be paid for (Microsoft, 2026).
- SQL Server 2016 is the first SQL Server version whose Extended Security Updates are not free after a move to Azure virtual machines; SQL Server 2014 workloads moved to Azure VMs still get them free (Microsoft, 2026).
- Only vulnerabilities rated Critical trigger SQL Server Extended Security Updates, so they have no regular release cadence, unlike Windows Server ESU, which also carries Important updates (Microsoft, 2026).
- Core-based licensing replaced per-processor licensing for Windows Server Standard and Datacenter in October 2016, when Windows Server 2016 became generally available (Microsoft, 2018).
- 16 core licences per server and 8 per physical processor are the minimums for licensing Windows Server 2025 Standard or Datacenter on physical cores, the same minimums ESU purchases follow (Microsoft, 2026).
- 8 core licences per virtual machine is the minimum when Windows Server is licensed by virtual machine, an option Microsoft added in October 2022 for subscription and Software Assurance customers (Microsoft, 2026).
- 3 more years of Extended Security Updates were offered free in Azure for Windows Server 2008 and SQL Server 2008 workloads after their end of support, Microsoft announced in July 2018, 18 months before the Windows Server deadline (Microsoft, 2018).
- Up to 55% was the saving Microsoft claimed for Software Assurance customers running SQL Server and Windows Server in Azure with the Azure Hybrid Benefit, in its July 2018 announcement for the 2008 end of support (Microsoft, 2018).
- 1 additional year of Extended Security Updates for Windows Server 2008 and 2008 R2, only on Azure, was announced by Microsoft in July 2021 alongside three free ESU years in Azure for Windows Server 2012 (Microsoft, 2021).
- 4 Azure platforms (Azure Virtual Machines, Azure Dedicated Host, Azure VMware Solution and Azure Stack HCI) qualified for free Extended Security Updates when Windows Server 2012/R2 reached end of support on 10 October 2023, Microsoft said, where its 2018 offer for 2008 named Azure virtual machines (Microsoft, 2023).
Hotpatching, the other paid update programme
- $1.50 per CPU core per month was the subscription price for hotpatching on Azure Arc-connected Windows Server 2025 servers when it became generally available on 16 July 2025 (Microsoft, 2025).
- $0 is the price of Azure Arc-enabled hotpatching for Windows Server 2025 since 15 May 2026, when Microsoft stopped all hotpatch billing ten months after launching it at $1.50 per core per month (Microsoft, 2026).
- Hotpatching for Windows Server 2025 outside Azure was in free preview and 'will require a monthly subscription' when Microsoft announced general availability in November 2024, while staying included for Datacenter: Azure Edition (Microsoft, 2024).
- 4 restarts a year instead of 12 is what Microsoft says hotpatching requires on Windows Server 2025, with quarterly baseline updates replacing monthly reboots (Microsoft, 2025).
- 8 hotpatch releases and 4 planned baseline releases make up a planned hotpatching year on Windows Server, with baselines in January, April, July and October requiring a restart (Microsoft, 2025).
- 3 different general-availability dates for Windows Server 2025 hotpatching appear in Microsoft's own posts: 1 July 2025 in the April 2025 announcement, 16 June 2025 in its 10 July update note, and 16 July 2025 in the Tech Community GA post (Microsoft, 2025).
- Hotpatch updates for Windows Server 2022 Datacenter: Azure Edition continue through October 2027, one year past the 13 October 2026 end of mainstream support, after Microsoft's June 2026 extension (Microsoft, 2026).
What staying unsupported cost last time
- $200,000 or more a year on average was Microsoft's own estimate of the cost of custom support for organisations keeping Windows Server 2003 past its July 2015 end of support (Microsoft via The Register, 2014).
- $1,500 per server per year was the budget Gartner advised for organisations planning to keep running Windows Server 2003 past its July 2015 deadline, as cited by Insight Enterprises in September 2014 (Gartner via Redmond, 2014).
Sources: Microsoft (2018-2026); The Register; Network World; Redmond Magazine
What happened after Windows Server 2003 and 2008 reached end of life?
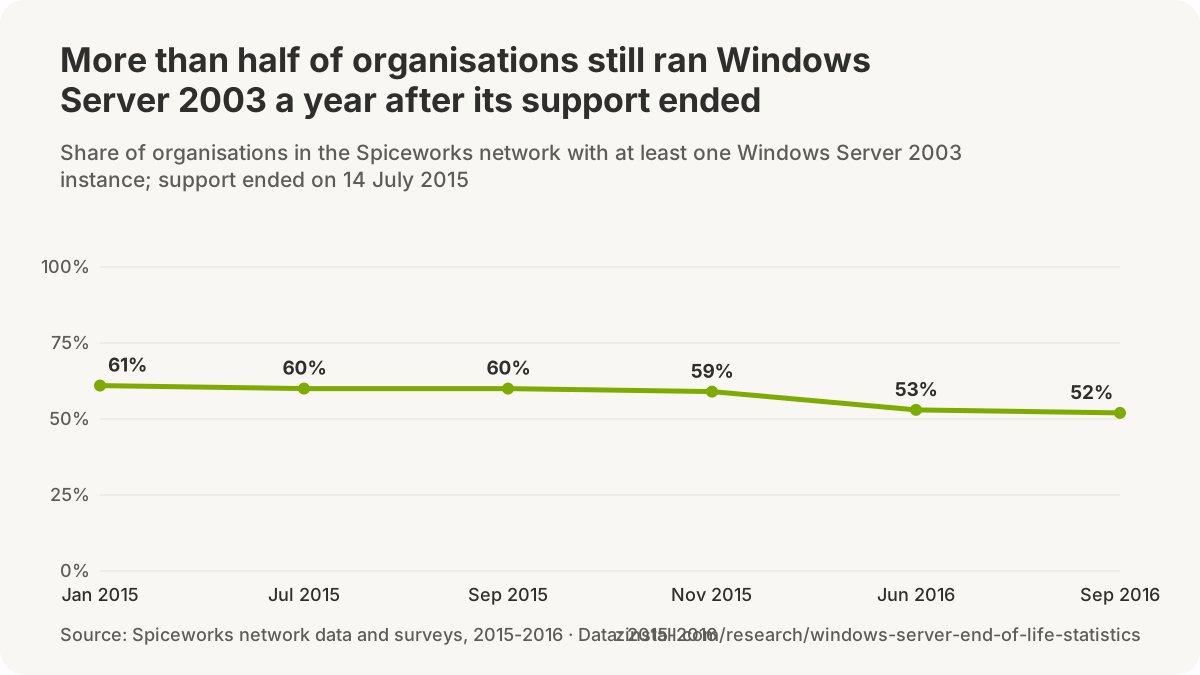
53% of organisations still ran Windows Server 2003 in June 2016, 11 months after its end of support (Spiceworks, 2016).

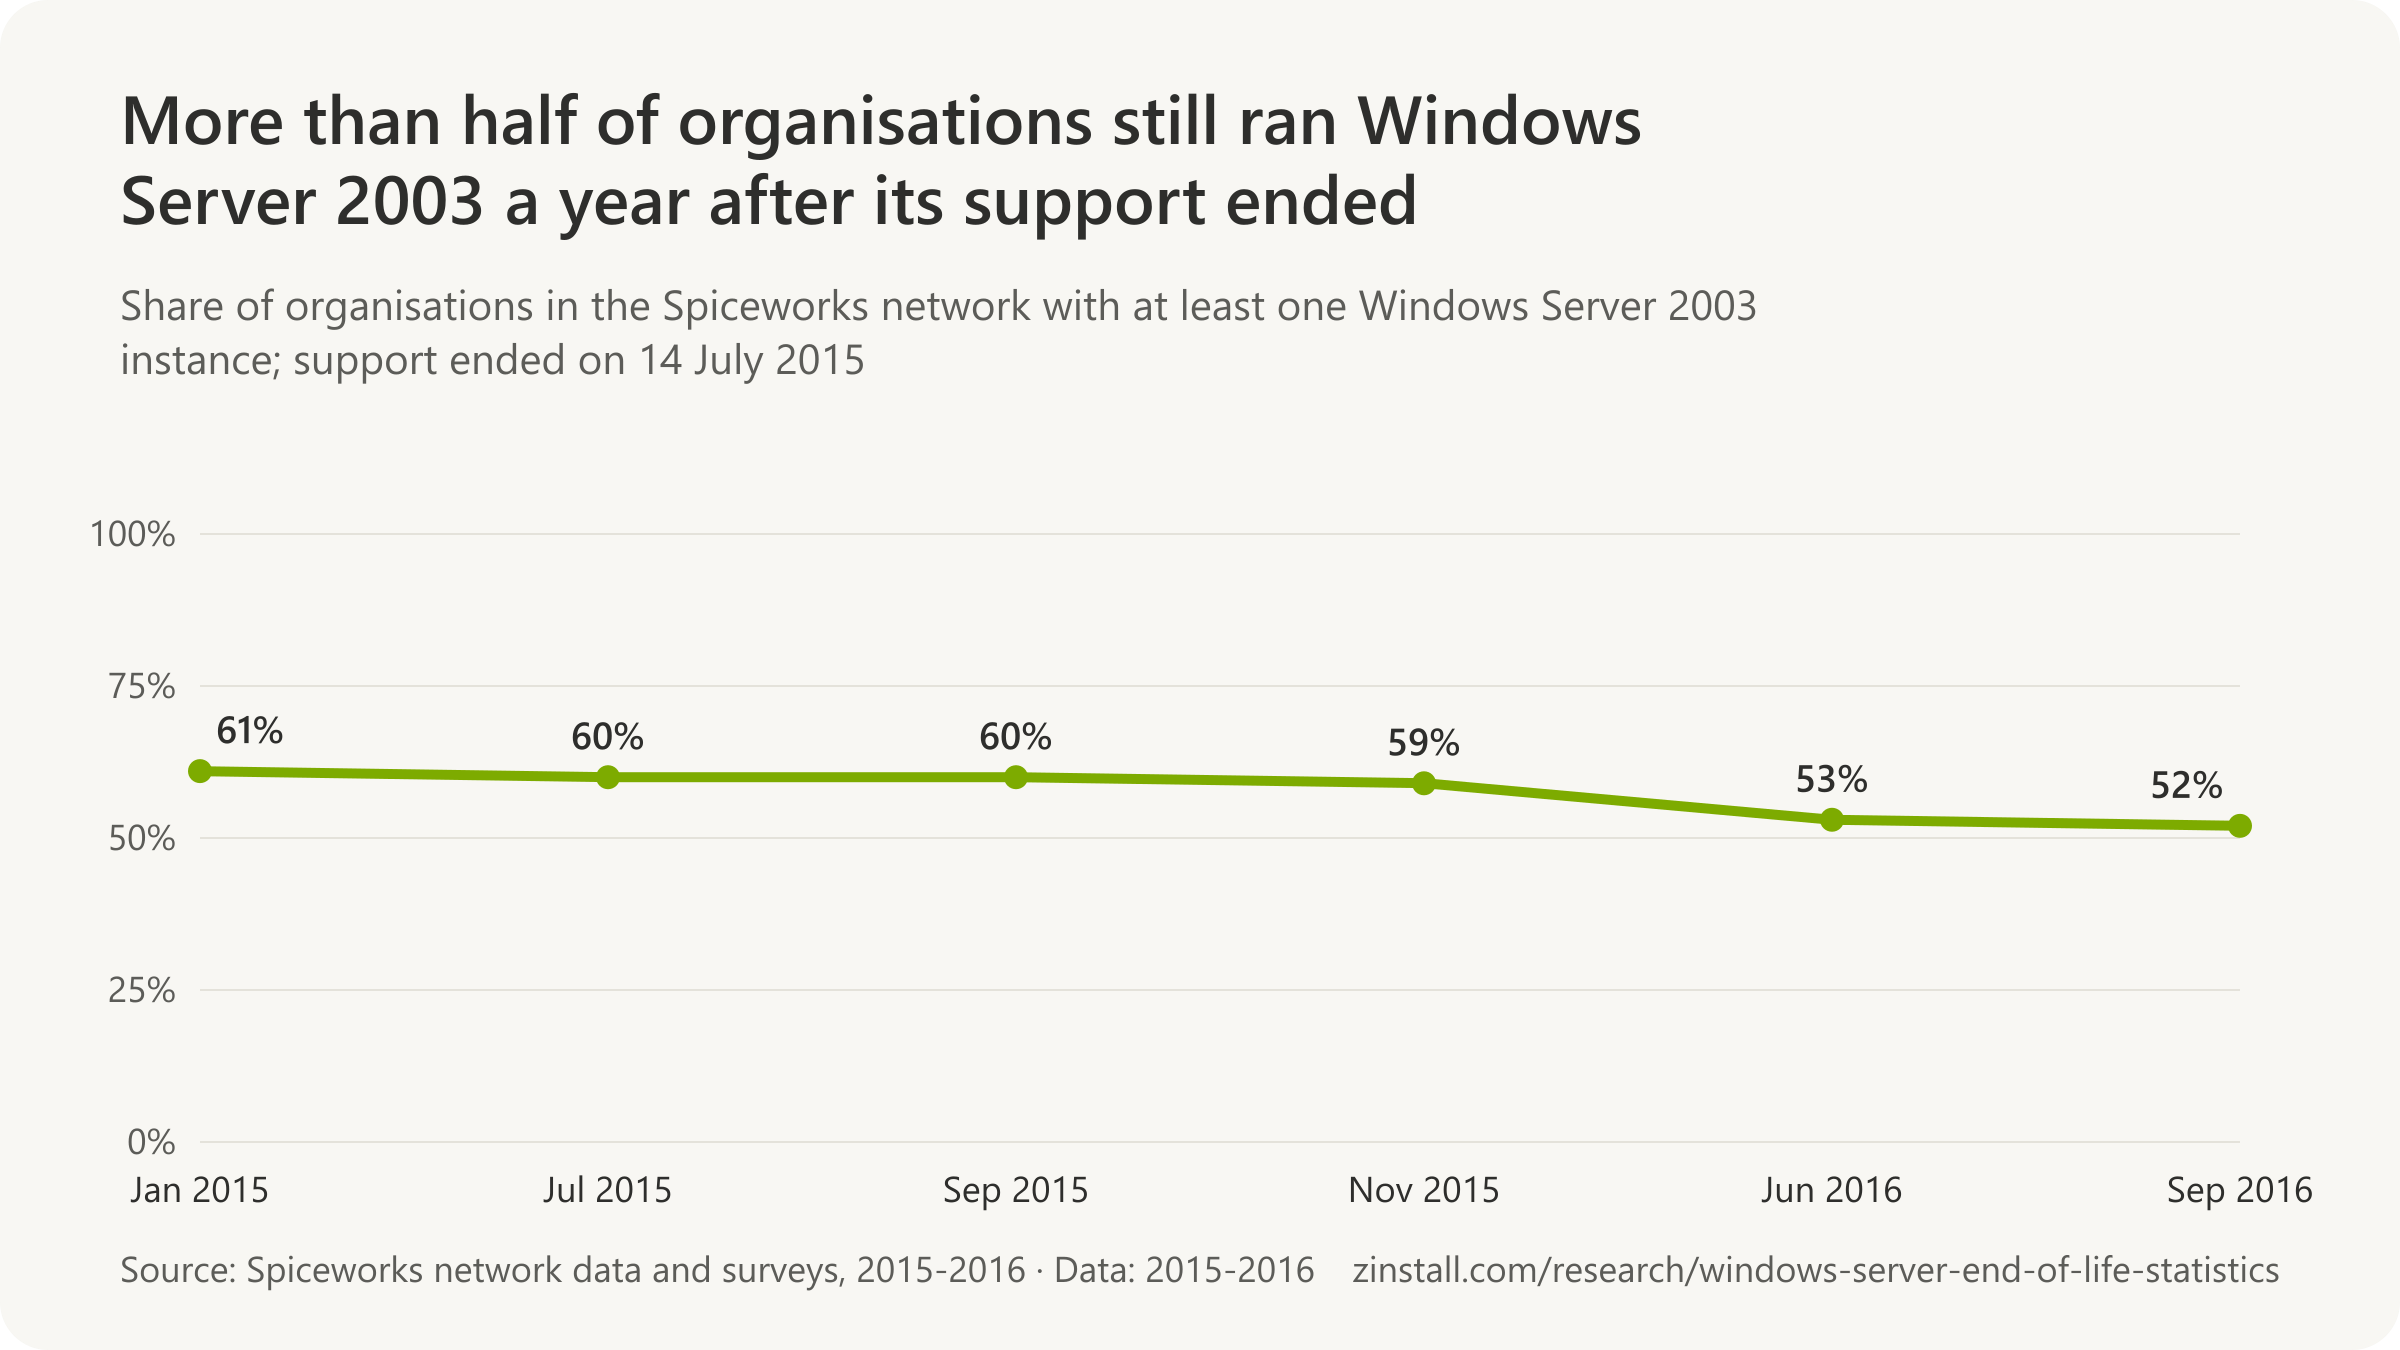
- Six months before the deadline, in January 2015, the share was 61%.
- In July 2019, six months before the deadline, Microsoft put 60% of its server install base on the 2008 versions.
- Microsoft's own July 2014 count was 22 million Windows Server 2003 instances; the 24 million quoted since has no Microsoft source.
- 4 points of Microsoft's 10% on-premises server growth at the end of 2019 came from Windows Server 2008's end of support.
- 609,000 web-facing computers still ran Windows Server 2003 in July 2015, the month its support ended.
| Finding | Share or amount |
|---|---|
| Fully migrated | 15% |
| Partially migrated | 48% |
| Still planning | 28% |
| No plans to migrate | 8% |
| Not upgrading every system | 22% |
| Those keeping it: citing software compatibility | 72% |
| Moving to Windows Server 2012 R2 | 64% |
| Naming Windows Server 2008 R2 as a path | 39% |
| Moving its applications to a virtualised environment | 74% |
| Average migration budget | $60,000 |
Sources: Spiceworks (2015, 2016); Redmond Channel Partner (2019, 2015); Microsoft; Netcraft
More statistics (80)
53% of companies in the Spiceworks network still had at least one instance of Windows Server 2003 running in June 2016, 11 months after its July 2015 end of support, down from 61% in January 2015 (Spiceworks, 2016).
Windows Server 2003 and Windows Server 2008 went through the same deadline a decade ago, and the audits and surveys of that time show how long the tail lasted. They are the only guide to what the 2012 and 2016 deadlines will look like a year on.
| Date and population | With at least one instance | Scope |
|---|---|---|
| June 2014, Asia Pacific organisations (cited by Microsoft) | 64.5% | Organisations in Asia Pacific using Spiceworks' tools (Spiceworks inventory data) · Asia Pacific · 2014-06 |
| January 2015 | 61% | Companies in the Spiceworks network (the release does not say whether this share comes from network inventory data or from the 1,300+ survey respondents) · North America, EMEA and Asia Pacific · 2015-01 |
| July 2015 | 60% | Organisations in the Spiceworks network (anonymised, aggregated usage data from Spiceworks' free inventory software), share with at least one instance of each server OS ('penetration rate') · Worldwide (Spiceworks network, mostly small and mid-sized businesses) · 2015-07 |
| September 2015 | 60% | Companies in the Spiceworks network (anonymised network data; date of the data not stated beyond the 30 September 2015 release) · North America and EMEA (Spiceworks network) · 2015-09 |
| November 2015 | 59% | Organisations in the Spiceworks network (anonymised, aggregated usage data from Spiceworks' free inventory software), share with at least one instance of each server OS ('penetration rate'), November 2015 · Worldwide (Spiceworks network, mostly small and mid-sized businesses) · 2015-11 |
| June 2016 | 53% | Physical servers and virtual machines, and the organisations running them, in Spiceworks' anonymised network inventory data, June 2016 (mostly on-premises, skewed to small and mid-sized businesses) · Worldwide (Spiceworks network, mostly on-premises) · 2016-06 |
| September 2016 | 52% | Organisations in the Spiceworks network (anonymised, aggregated usage data) · Worldwide (Spiceworks network, mostly small and mid-sized businesses) · 2016-09 |
| Finding | Figure |
|---|---|
| Fully migrated | 15% |
| Partially migrated | 48% |
| Still planning | 28% |
| No plans to migrate | 8% |
| Not upgrading every system | 22% |
| Those keeping it: citing software compatibility | 72% |
| Moving to Windows Server 2012 R2 | 64% |
| Naming Windows Server 2008 R2 as a path | 39% |
| Moving its applications to a virtualised environment | 74% |
| Average migration budget | $60,000 |
- 32% of IT professionals planning operating system refreshes in 2016 said they planned a Windows Server 2003 migration, months after its July 2015 end of support, in Spiceworks' July 2015 survey of 839 IT professionals in North America and EMEA (Spiceworks, 2015).
- 21% of about 87,000 client servers scanned by Softchoice between October 2014 and March 2015 still ran Windows Server 2003, four to nine months before its end of support, 7 points fewer than a year earlier (Softchoice via Redmond Channel Partner, 2015).
- 28% of servers scanned by Softchoice ran Windows Server 2003 a year before its October 2014 to March 2015 scans, implied by Softchoice's 21% being 7 points lower (Softchoice via Redmond Channel Partner, 2015).
- 66% of the servers Softchoice scanned between October 2014 and March 2015 ran Windows Server 2008 and only 12% Windows Server 2012, as organisations leaving Server 2003 chose 2008 (Softchoice via Redmond Channel Partner, 2015).
- 18% of virtual machine instances in CloudPhysics' sample of VMware datacenters ran Windows Server 2003 in June 2015, weeks before its end of support, and CloudPhysics projected some use until mid-2018 (CloudPhysics via Redmond, 2015).
- 1 in 6 Windows Server 2003 instances hosted SQL Server 2005, Microsoft said on its Windows Server 2003 end-of-support page in June 2015, a month before the deadline (Microsoft, 2015).
- 200 days for a typical server migration and over 300 days for an application migration was Microsoft's estimate a year before Windows Server 2003's end of support (Microsoft, 2014).
- 62% of customers had no plan to upgrade or migrate from Windows Server 2003, or did not know its support was ending, in AppZero's survey at the start of 2014 (AppZero via The Register, 2014).
- 30% of US and UK enterprises planned to keep running Windows Server 2003 after its 14 July 2015 deadline, in Bit9 + Carbon Black's February 2015 survey of 500 IT leaders (Bit9 + Carbon Black, 2015).
- 57% of US and UK enterprises did not know when Windows Server 2003's end-of-life deadline was, four months before it, in Bit9 + Carbon Black's February 2015 survey of 500 IT leaders (Bit9 + Carbon Black, 2015).
- 68% of 153 UK organisations running Windows Server 2003 would keep using it past its July 2015 end of life, and 38% of those upgrading would miss the deadline, in Bit9 + Carbon Black's survey (Bit9 + Carbon Black via DatacenterDynamics, 2015).
- One in five businesses running Windows Server 2003 would miss its July 2015 end-of-support deadline, Gartner had predicted, The Register reported on 27 November 2014, an earlier 'one in five' about a different version (The Register, 2014).
- 39 servers of the more than 2,200 on the Scottish Government network still ran Windows Server 2003 in June 2017, almost two years after its end of support, with 22 being decommissioned (Scottish Government, 2017).
- 35 Scottish Government servers were still on Windows Server 2003 by late July 2017, down from 39 in June 2017, two years after its end of support (Scottish Government, 2017).
- 24% of English councils answering Comparex's April 2018 FOI requests still ran Windows 2000 Server or Windows Server 2003, nearly three years after Server 2003's end of support, and 38% ran SQL Server 2005 (Comparex via PublicTechnology, 2018).
| Estimate, date and source | Figure | Scope |
|---|---|---|
| Microsoft (John Case), July 2014: instances | 22 million | Windows Server 2003 instances worldwide (Microsoft statement at WPC 2014) · Worldwide · 2014-07 |
| Data Center Knowledge, September 2014: 'Microsoft estimate', instances | 23.8 million | Windows Server 2003 instances worldwide, physical and virtual (Microsoft estimate; method not published) · Worldwide · 2014-09 |
| Redmond Magazine, September 2014: 'Microsoft data', instances | 24 million instances on 12 million servers | Windows Server 2003 instances worldwide (Microsoft estimate, method not stated) · Worldwide · 2014-07 |
| Insight Enterprises, September 2014: 'servers' | 24 million | Windows Server 2003 installations worldwide (as restated by a Microsoft licensing partner) · Worldwide · 2014-09 |
| CIO.com, September 2014: 'servers' | 24 million | Windows Server 2003 installations (as restated) · Worldwide; United States · 2014-09 |
| US-CERT alert, November 2014: physical servers (citing Redmond) | 12 million (restated) | Physical servers running Windows Server 2003 (source's estimate) · Worldwide · 2014-07 |
| BizTech, November 2014: instances | 24 million instances | Windows Server 2003 instances worldwide (Microsoft estimate) · Worldwide · 2014-07 |
| Distributique, March 2015: instances | 23.8 million instances on 11.9 million servers | Windows Server 2003 instances worldwide (Microsoft estimate) · Worldwide · 2014-07 |
| BizTech, April 2015: 'deployed' | more than 23 million | Windows Server 2003 instances (unspecified) · Worldwide · 2015-04 |
| Network World, July 2015: instances | almost 24 million | Windows Server 2003 instances worldwide (Microsoft statement) · Worldwide · 2014-07 |
| PCWorld, July 2015: instances | almost 24 million | Windows Server 2003 instances worldwide (Microsoft estimate) · Worldwide · 2014-07 |
| HP via The Register, May 2014: systems | 11 million | Servers running Windows Server 2003 worldwide (HP estimate; method not published) · Worldwide · 2014-05 |
| HP via ChannelBuzz, July 2014: servers | 11 million | Servers running Windows Server 2003 worldwide (HP estimate) · Worldwide · 2014-07 |
| CRN, July 2014: servers | 11.7 million | Servers running Windows Server 2003 worldwide (HP figure as reported by CRN) · Worldwide · 2014-07 |
| HKCERT, August 2015: systems (citing HP) | approximately 11 million | Systems running Windows Server 2003 worldwide (HP estimate) · Worldwide · 2014-05 |
| HP via The Register, July 2014: servers in Europe | 2.7 million | Servers running Windows Server 2003 in Europe (HP estimate; method not published) · Europe · 2014-07 |
| Dell via Computerworld, July 2014: servers | up to 12 million | Servers running Windows Server 2003 worldwide (Dell estimate; method not published) · Worldwide · 2014-07 |
| Digitimes, November 2014: servers (unnamed sources) | more than 10 million | Windows Server 2003 servers worldwide (unnamed industry sources) · Worldwide (Taiwan server-maker sources) · 2014-11 |
| Gartner via The Register, November 2014: servers | 8 million | Servers running Windows Server 2003 worldwide (Gartner estimate; method not published) · Worldwide · 2014-11 |
| Gartner, November 2014: systems to be replaced | 5.5 million | Servers running Windows Server 2003 worldwide (Gartner forecast) · Worldwide · 2014-11 |
| Bit9 + Carbon Black, March 2015: systems (unsourced) | about 9 million | Windows Server 2003 systems worldwide (no source or method given) · Worldwide · 2015-03 |
| Bit9 + Carbon Black: servers left unprotected | 2.7 million | Windows Server 2003 systems worldwide (Bit9's base of about 9 million, times the 30% planning to stay) · Worldwide (extrapolated) · 2015-02 |
| TechRadar, March 2015: installations (no source) | 2.6 million to 11 million | Windows Server 2003 installations worldwide (unsourced) · Worldwide · 2014-11 |
| TechRadar, 25 March 2015: users | 2.6 million to 11 million | Windows Server 2003 'users' (unspecified) · Worldwide · 2015-03 |
| The Register's arithmetic, May 2014: upgrades a day needed | 25,000 a day | HP's estimate of 11 million Windows Server 2003 systems divided by the 438 days left · Worldwide · 2014-05 |
Windows Server 2008 and 2008 R2, January 2020
- 94% of English councils answering Comparex's April 2018 FOI requests were using Windows Server 2008, 21 months before its January 2020 end of support, and as many ran SQL Server 2008 (Comparex via PublicTechnology, 2018).
- About 60% of Microsoft's server install base was on Windows Server 2008 and SQL Server 2008 in July 2019, six months before Windows Server 2008's end of support, by Microsoft's internal estimates (Microsoft via Redmond Channel Partner, 2019).
- 24 million instances, or 60% of Microsoft's server installed base, remained on Windows Server 2008 and/or SQL Server 2008 in mid-2019 by a Microsoft estimate reported by Redmond Magazine, the same count as the 24 million Server 2003 instances that 2014 reports attributed to Microsoft (Microsoft via Redmond, 2019).
- 60% of Microsoft's 'current Windows Server installed base' was running Server 2008, Network World reported on 15 January 2020, dropping the SQL Server 2008 that Microsoft's July 2019 estimate included (Network World, 2020).
- 60% of Windows Servers were running Windows Server 2008 as of July 2019, Wikipedia's Windows Server 2008 article states, citing a January 2020 Channel Asia article rather than Microsoft, and omitting the SQL Server 2008 in Microsoft's estimate (Wikipedia, 2026).
- $50 billion was the partner market opportunity Microsoft put on migrations off Windows Server 2008 and SQL Server 2008 at its July 2019 Inspire conference, against $6 billion it gave for Windows Server 2003 in 2014 (Microsoft via Redmond Channel Partner, 2019).
- Roughly 4 points of the 10% growth in Microsoft's on-premises server business in October to December 2019 came from the end of support for Windows Server 2008, Microsoft's CFO said on its January 2020 earnings call (Microsoft, 2020).
- Nearly one-third of Microsoft's Windows Server and SQL Server enterprise customers were using its hybrid use benefits to deploy Azure in January 2020, the month Windows Server 2008 left support, Microsoft's CFO said (Microsoft, 2020).
- One-third of organisations bought new servers because the server's operating system reached end of life, Spiceworks found in early 2019, ten months before Windows Server 2008's end of support (Spiceworks via CIO Dive, 2019).
- 15% of 2,396 SQL Server instances monitored by Brent Ozar Unlimited's SQL ConstantCare service ran SQL Server 2008 or 2008 R2 in March 2019, 15 weeks before their 9 July 2019 end of support (Brent Ozar Unlimited, 2019).
- 59% of all uniquely observed internet-exposed Windows Server instances were running unsupported versions in Rapid7's September 2020 Project Sonar scans, against 41% supported, eight months after Windows Server 2008 and 2008 R2 left support (Rapid7, 2020).
- 2,000,000+ internet-exposed Windows Server 2008 R2 instances disappeared from Rapid7's Project Sonar scans in the months after its January 2020 end of support, against about 40,000 for Windows Server 2008 (Rapid7, 2020).
- 887,000 web-facing computers were running Windows Server 2008 or 2008 R2 in January 2020, the month Microsoft ended their support, making them the most popular Windows versions in the web-server market (Netcraft, 2020).
- Over half of all Windows web-facing computers counted by Netcraft in January 2020 ran an end-of-life version of Windows once Windows Server 2008 and 2008 R2 left support on 14 January 2020 (Netcraft, 2020).
- Almost 2.85 million active sites ran on IIS 7.5, the version built into Windows Server 2008 R2, in January 2020, 32.5% of all active sites on any IIS version, with about 940,000 more on even older IIS versions (Netcraft, 2020).
- 'A 2020 study by Rapid7 of unique Windows Server instances found that 59% were unsupported', a Forbes Technology Council post said in September 2023, dropping that Rapid7 counted only internet-exposed instances (Forbes Technology Council, 2023).
Windows Server 2003 on the web
- 609,000 web-facing computers were still running Windows Server 2003 in July 2015, the month its extended support ended, over 10% of all web-facing computers in Netcraft's survey (Netcraft, 2015).
- 175 million websites were served directly from Windows Server 2003 computers in July 2015, more than a fifth of all websites in Netcraft's survey, 73% of them by IIS 6.0 (Netcraft, 2015).
- 55% of the world's web-facing Windows Server 2003 computers were in China (169,000) and the United States (166,000) in July 2015, against 43% of all other web-facing computers (Netcraft, 2015).
- 53% of companies were 'still running' Windows Server 2003 a year after its end of life, as Data Center Knowledge headlined Spiceworks' 2016 finding, dropping the qualifier 'at least one instance' (Data Center Knowledge, 2016).
- 24% of servers were said to run 'Windows Server 2013' in BetaNews' July 2016 report of Spiceworks' data, a Windows Server version that does not exist; Spiceworks measured Windows Server 2012 (BetaNews, 2016).
- 40,000 pounds was the average Windows Server 2003 migration budget as TechRadar reported Spiceworks' study, converting Spiceworks' $60,000 into sterling and back to about $59,500 (TechRadar, 2015).
Sources: Spiceworks (2015, 2016); Microsoft (2014, 2015, 2020); Redmond Channel Partner (2015, 2019); Redmond Magazine (2014, 2015, 2019); The Register (2014); Bit9 + Carbon Black; DatacenterDynamics; Scottish Government (2017); PublicTechnology; Data Center Knowledge (2014, 2016); Insight Enterprises; CIO.com; Cybersecurity and Infrastructure Security Agency; BizTech Magazine (2014, 2015); Distributique; Network World (2015, 2016, 2020); PCWorld; ChannelBuzz.ca; CRN; Hong Kong Computer Emergency Response Team Coordination Centre; Computerworld; Digitimes; TechRadar (2015); Wikipedia; CIO Dive; Brent Ozar Unlimited; Rapid7; Netcraft (2015, 2020); Forbes Technology Council; BetaNews
How many businesses still run on-premises servers?
98% of businesses in North America and Europe ran server hardware on their own premises in 2019 (Spiceworks, 2019).

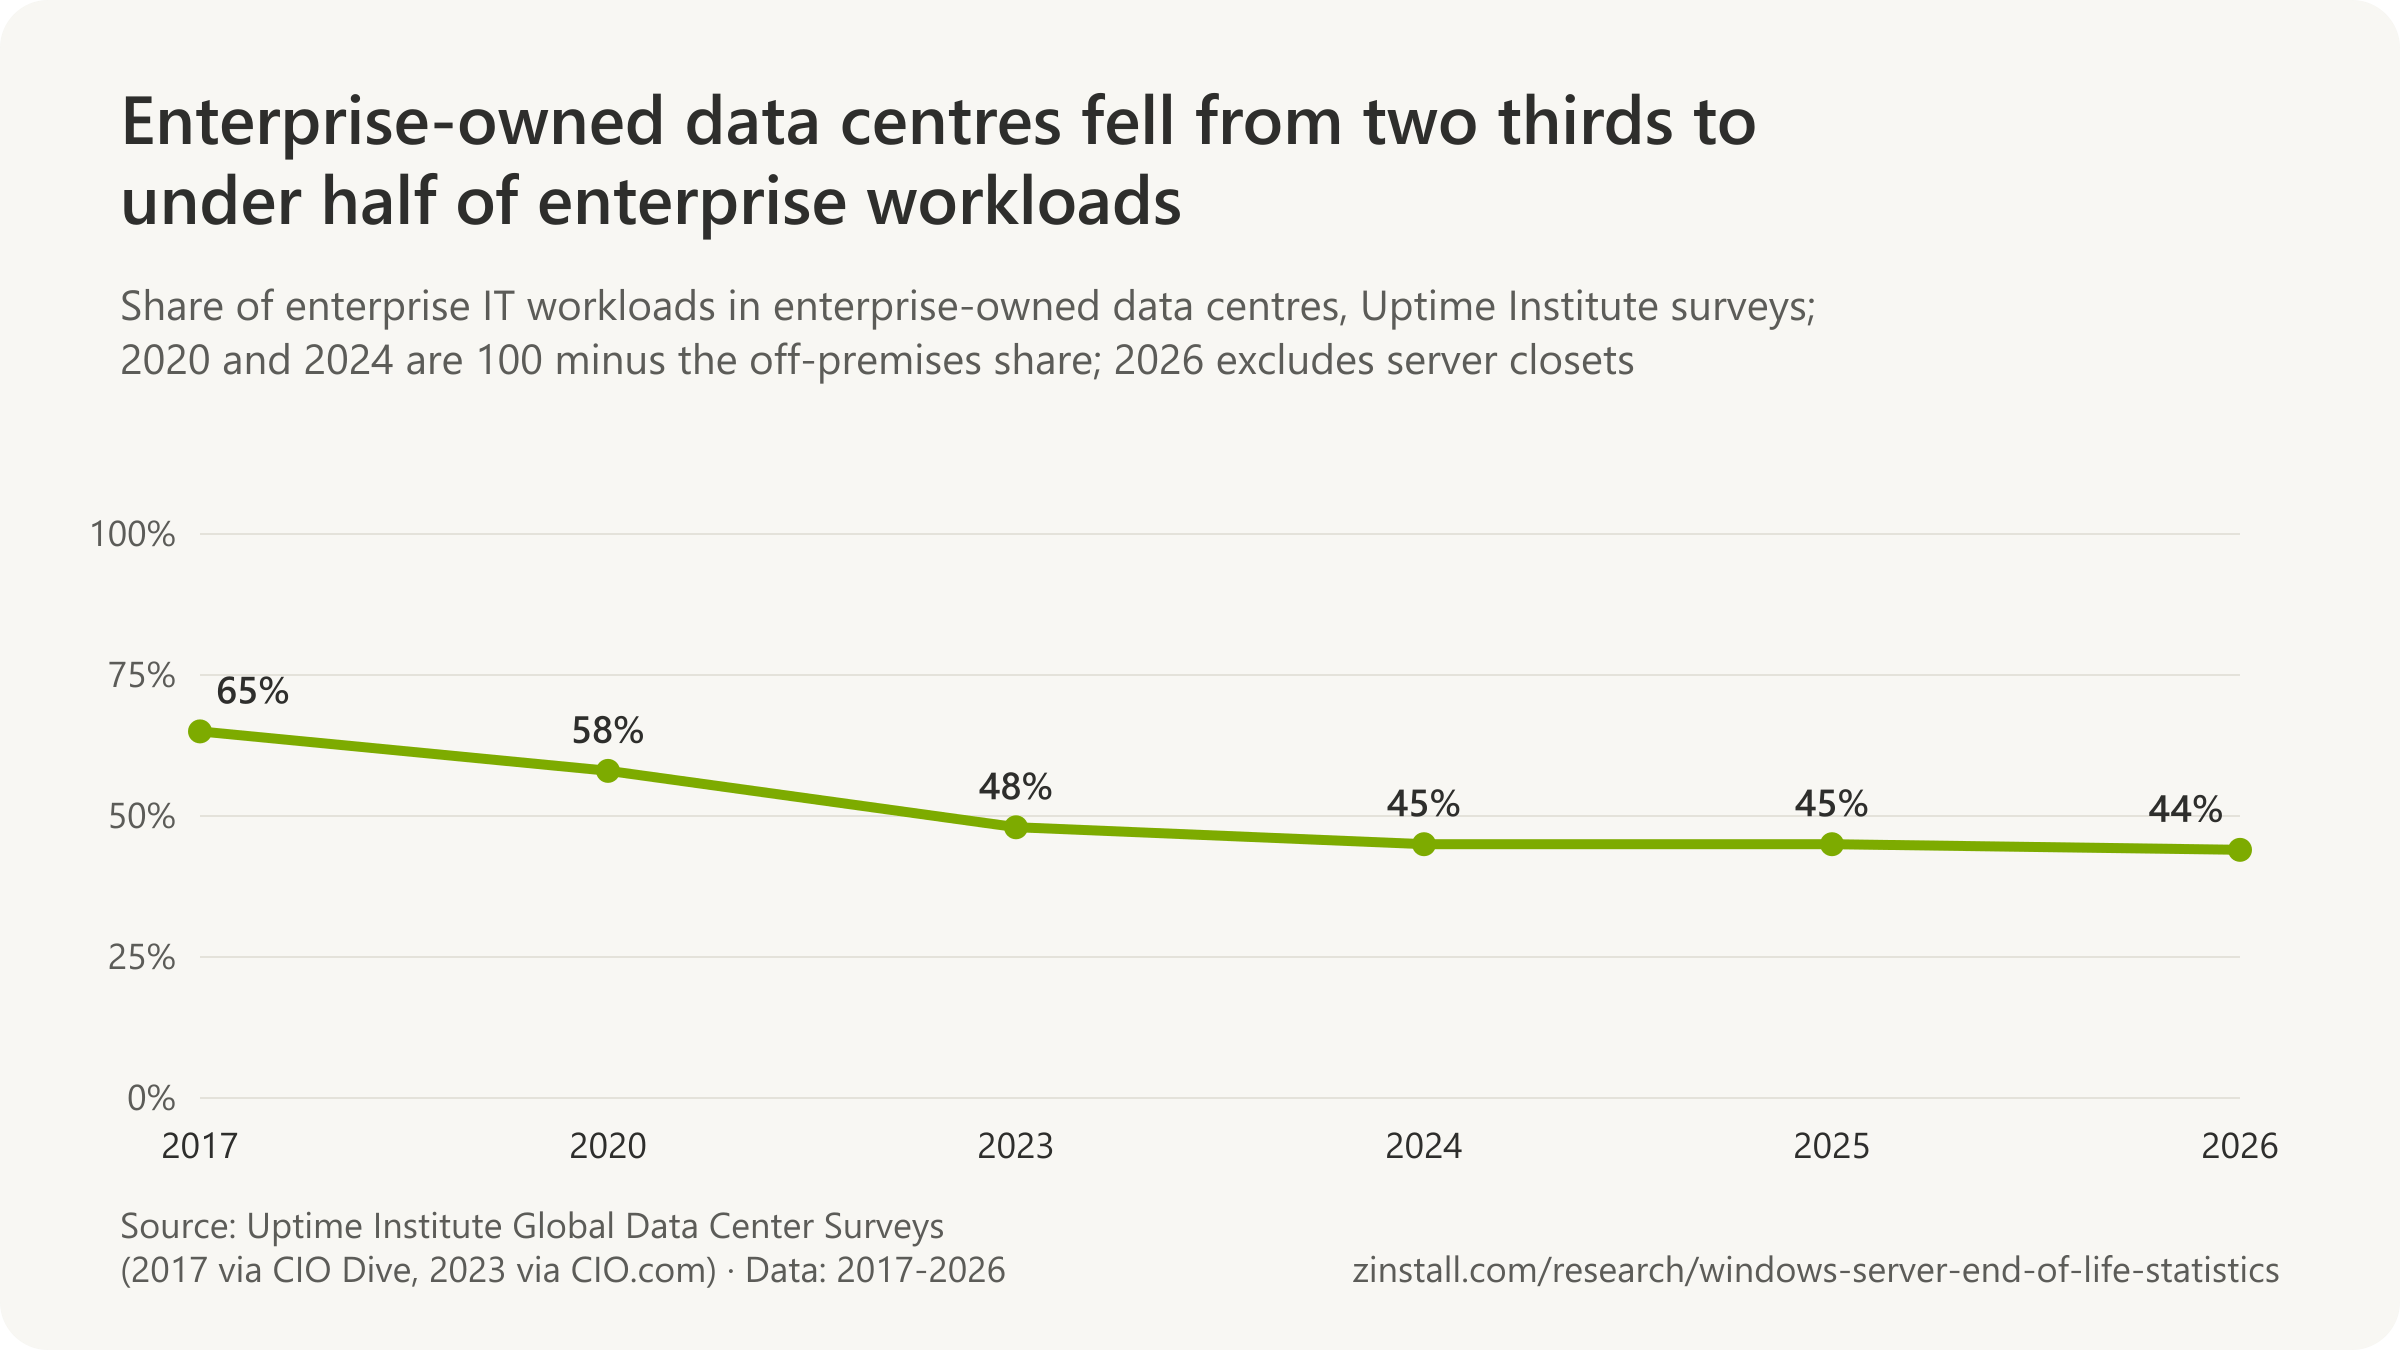
- 44% of enterprise workloads still ran in enterprise-owned data centres in 2026, with third-party venues at 46% (Uptime Institute, 2026).
- Enterprises ran 54% of their workloads in public cloud in 2026, so 46% still ran outside it.
- 36% of businesses planned to buy new server hardware within 12 months, in 2019.
- Microsoft's on-premises server revenue rose 3% at the end of 2023, driven mainly by Windows Server 2012's end of support.
- On-premise enterprise data centres held 34% of the world's data-centre capacity in early 2025, down from almost 56%.
| Budget year | Share of hardware budget |
|---|---|
| 2016 (via eWeek) | 19% |
| 2017 | 17% |
| 2018 | 13% |
| 2019 | 12% |
| 2021 | 12% |
| 2022 | 11% |
| 2026 | 13.3% |
Sources: Spiceworks (2025, 2019, 2016); Uptime Institute (2026, 2025, 2024); Flexera; Microsoft; Synergy Research Group; eWeek; Spiceworks Ziff Davis; CIO Dive; CIO.com
More statistics (89)
98% of businesses in North America and Europe were running server hardware on-premises in Spiceworks' February 2019 survey of 530 IT decision makers (Spiceworks, 2019).
The cloud did not empty the server room. The surveys below ask IT departments where their workloads run, how many still own servers and what they plan to buy; the analyst firms count the servers shipped and the money spent on them.
| Survey year and measure | Share | Scope |
|---|---|---|
| 2017: in enterprise-owned data centres (via CIO Dive) | 65% | Enterprise IT and data center managers answering Uptime Institute's annual Global Data Center Survey (organisations that own or use data centers) · Worldwide · 2017 |
| 2020: off-premises | 42% | Enterprise IT and data center managers answering Uptime Institute's annual Global Data Center Survey (organisations that own or use data centers) · Worldwide · 2020 |
| 2023: in corporate, on-premises facilities | below half | Enterprise IT and data center managers answering Uptime Institute's annual Global Data Center Survey (organisations that own or use data centers) · Worldwide · 2023 |
| 2023: in corporate data centres (via CIO.com) | 48% (2023), 58% (2020) | Enterprise IT and data center managers answering Uptime Institute's annual Global Data Center Survey (organisations that own or use data centers) · Worldwide · 2023 |
| 2024: off-premises | 55% | Enterprise IT and data center managers answering Uptime Institute's annual Global Data Center Survey (organisations that own or use data centers) · Worldwide · 2024 |
| 2025: in corporate data centres | 45% | Enterprise IT and data center managers answering Uptime Institute's annual Global Data Center Survey (organisations that own or use data centers) · Worldwide · 2025 |
| 2026: in third-party venues against enterprise-owned data centres | 46% vs 44% | Enterprise IT and data center managers answering Uptime Institute's annual Global Data Center Survey (organisations that own or use data centers) · Worldwide · 2026 |
| 2028 forecast: third-party venues against enterprise-owned | 48% vs 42% (2028 forecast) | Enterprise IT and data center managers answering Uptime Institute's annual Global Data Center Survey (organisations that own or use data centers) · Worldwide · 2028 |
| 2021: operators that had not moved workloads back from public cloud | about 70% (32% had) | Data center owners and operators answering Uptime Institute's 2021 Global Data Center Survey · Worldwide · 2021 |
| Report year and population | Share | Scope |
|---|---|---|
| 2020, all respondents | 53% | Cloud decision-makers and users at organisations with 100 to 10,000+ employees (Flexera State of the Cloud survey) · Worldwide · 2020-Q1 |
| 2020, enterprises | 48% | Cloud decision-makers and users at organisations with 100 to 10,000+ employees (Flexera State of the Cloud survey) · Worldwide · 2020-Q1 |
| 2021, enterprises | 47% | Cloud decision-makers and users at organisations with 100 to 10,000+ employees (Flexera State of the Cloud survey) · Worldwide · 2020-Q4 |
| 2022, all respondents | 50% | Cloud decision-makers and users at organisations with 100 to 10,000+ employees (Flexera State of the Cloud survey) · Worldwide · 2021-Q4 |
| 2022, enterprises | 49% | Cloud decision-makers and users at organisations with 100 to 10,000+ employees (Flexera State of the Cloud survey) · Worldwide · 2021-Q4 |
| 2023, enterprises | 50% | Cloud decision-makers and users at organisations with 100 to 10,000+ employees (Flexera State of the Cloud survey) · Worldwide · 2022-Q4 |
| 2024, all respondents | 51% | Cloud decision-makers and users at organisations with 100 to 10,000+ employees (Flexera State of the Cloud survey) · Worldwide · 2023-Q4 |
| 2024, enterprises | 49% | Cloud decision-makers and users at organisations with 100 to 10,000+ employees (Flexera State of the Cloud survey) · Worldwide · 2023-Q4 |
| 2026, enterprises | 54% | Cloud decision-makers and users at organisations with 100 to 10,000+ employees (Flexera State of the Cloud survey) · Worldwide · 2025-Q4 |
| 2026, small and medium businesses | 63% | Cloud decision-makers and users at organisations with 100 to 10,000+ employees (Flexera State of the Cloud survey) · Worldwide · 2025-Q4 |
| 2025: cloud workloads already moved back | 21% | Cloud decision-makers and users at organisations with 100 to 10,000+ employees (Flexera State of the Cloud survey) · Worldwide · 2024-Q4 |
| 2026: change in workloads moved back | +2 pts | Cloud decision-makers and users at organisations with 100 to 10,000+ employees (Flexera State of the Cloud survey) · Worldwide · 2025-Q4 |

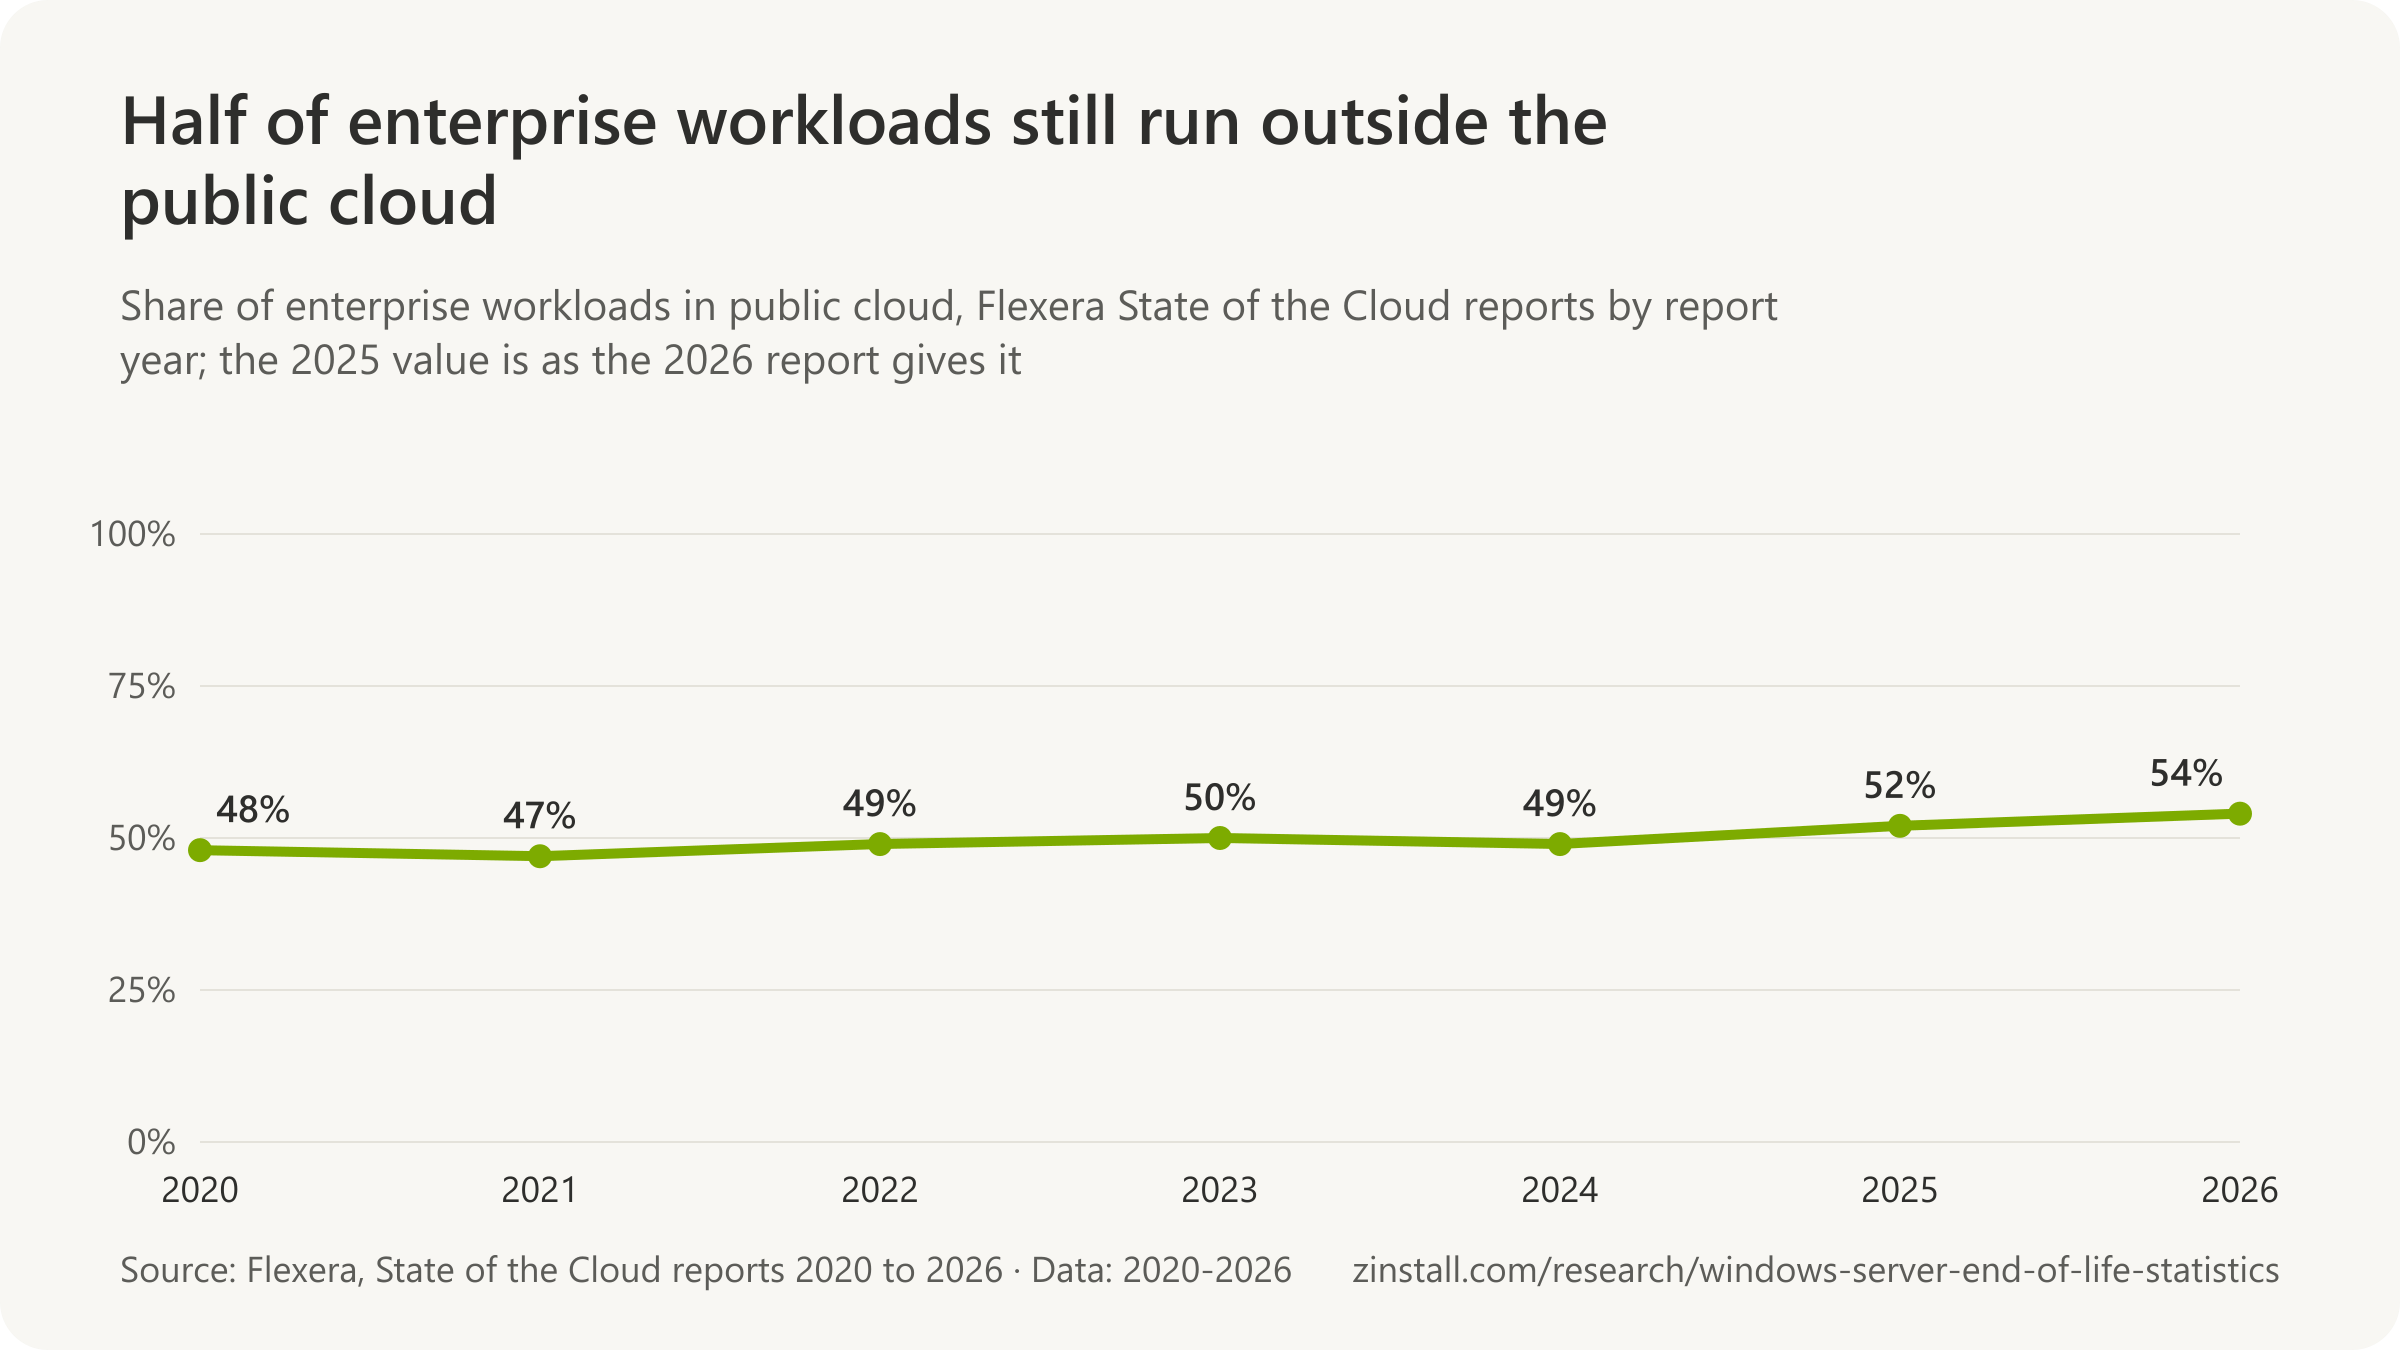
| Budget year | Share of hardware budget | Scope |
|---|---|---|
| 2016 (via eWeek) | 19% | IT buyers at businesses in North America and Europe (Spiceworks / Spiceworks Ziff Davis State of IT survey) · North America and Europe · 2016 |
| 2017 | 17% | IT buyers at businesses in North America and Europe (Spiceworks / Spiceworks Ziff Davis State of IT survey) · North America and Europe · 2017 |
| 2018 | 13% | IT buyers at businesses in North America and Europe (Spiceworks / Spiceworks Ziff Davis State of IT survey) · North America and Europe · 2018 |
| 2019 | 12% | IT buyers at businesses in North America and Europe (Spiceworks / Spiceworks Ziff Davis State of IT survey) · North America and Europe · 2019 |
| 2021 | 12% | IT buyers at businesses in North America and Europe (Spiceworks / Spiceworks Ziff Davis State of IT survey) · North America and Europe · 2021 |
| 2022 | 11% | IT buyers at businesses in North America and Europe (Spiceworks / Spiceworks Ziff Davis State of IT survey) · North America and Europe · 2022 |
| 2026 | 13.3% | IT buyers at businesses in North America and Europe (Spiceworks / Spiceworks Ziff Davis State of IT survey) · North America and Europe · 2026 |

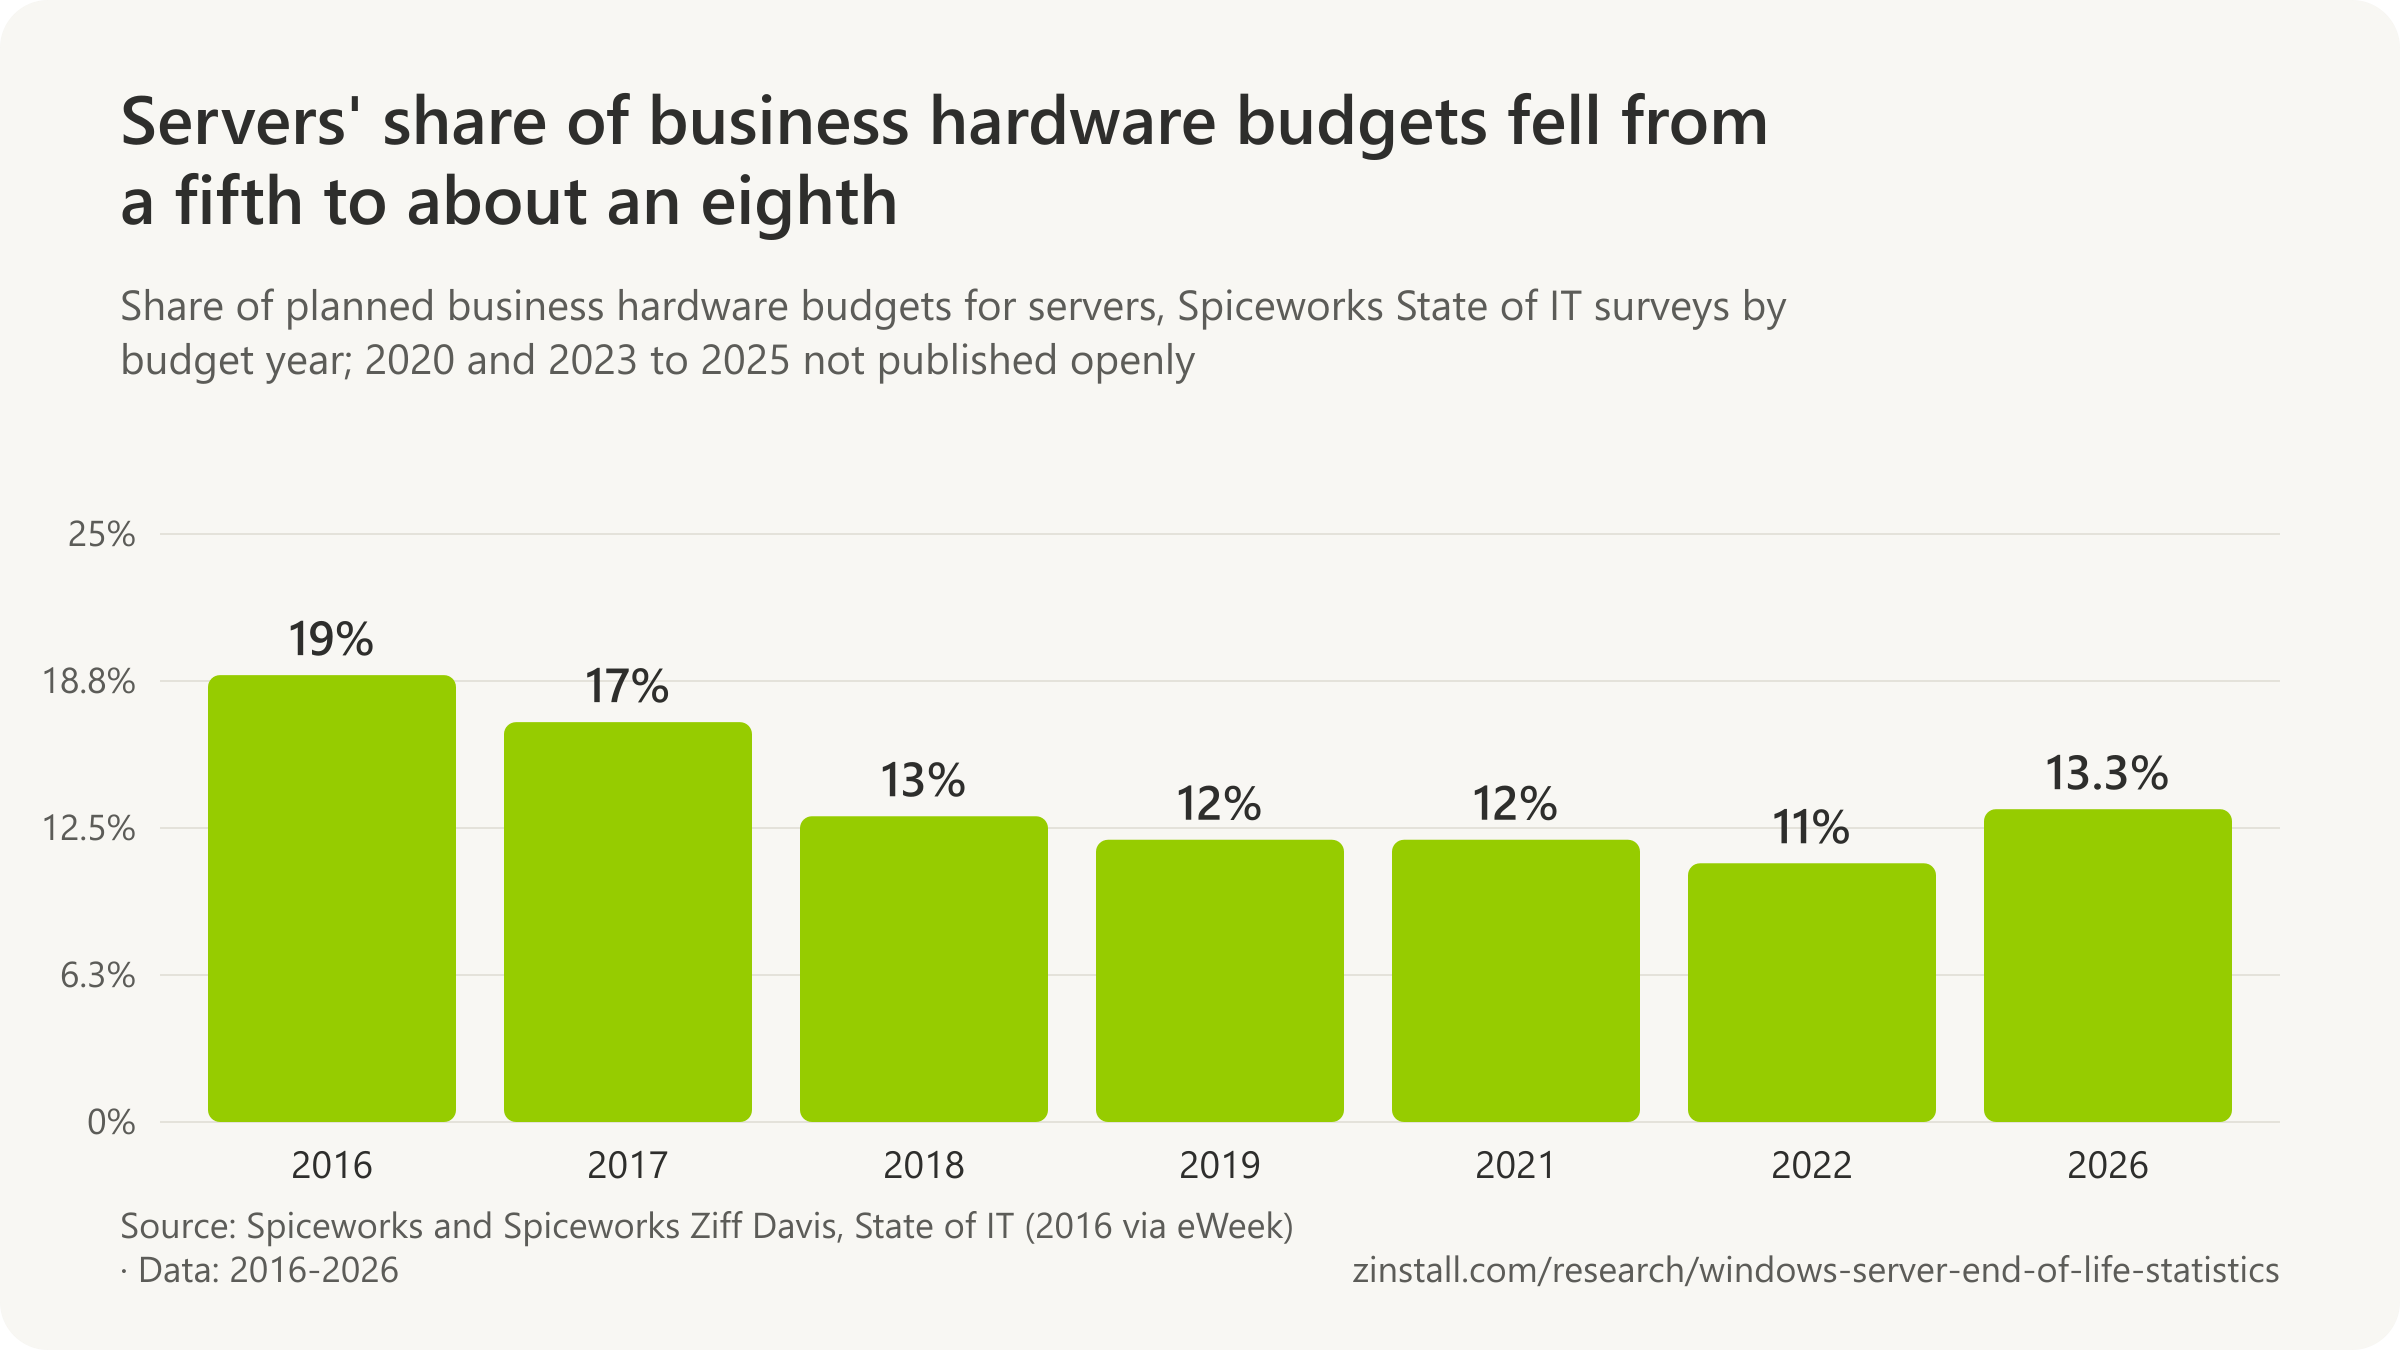
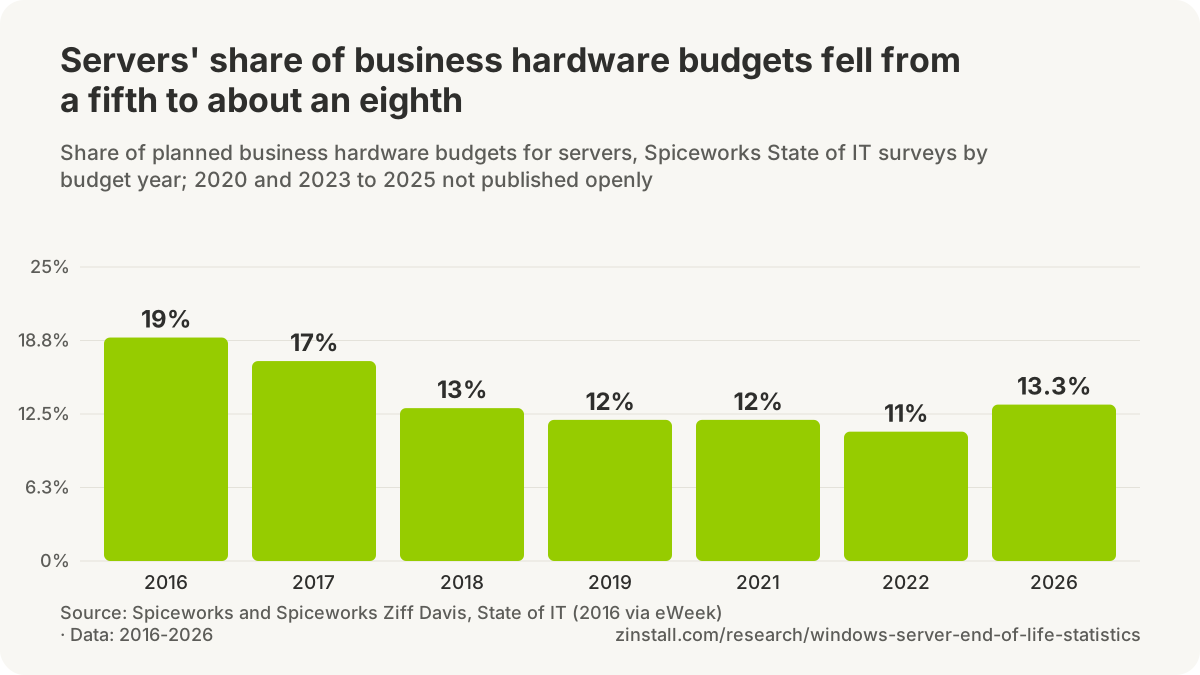
- 33% of business IT budgets for 2020 were planned for hardware, down from 35% in 2019, in Spiceworks' 2020 State of IT survey of more than 1,000 technology buyers (Spiceworks, 2019).
- 31% of business IT budgets for 2021 were planned for hardware, down from 35% in 2019, while hosted and cloud services rose to 24% from 21%, in the 2021 State of IT survey (Spiceworks Ziff Davis, 2020).
- 30% of business IT budgets in 2022 went to hardware, down from 33% in 2020, while cloud rose from 22% to 26%, in Spiceworks Ziff Davis' Hardware Trends survey of more than 1,000 IT professionals as ITAM Review reported it (SWZD via ITAM Review, 2022).
- 23% of business IT budgets for 2023 were planned for cloud services, down from 26% in 2022 (and up from 22% in 2020) as workers returned to offices, in the 2023 State of IT survey of more than 1,400 IT professionals (Spiceworks Ziff Davis, 2022).
- 50% of all business workloads were expected to run in the cloud by 2023, up from 40% in 2021, in Spiceworks Ziff Davis' 2021 cloud research cited in its 2022 State of IT (Spiceworks Ziff Davis, 2021).
- 35% of organisations had already migrated, or planned to accelerate migrating, workloads to the cloud because of COVID-19, in the 2021 State of IT survey of more than 1,000 IT decision makers (Spiceworks Ziff Davis, 2020).
- 64% of companies increasing IT budgets for 2019 were doing so to upgrade outdated IT infrastructure, in Spiceworks' 2019 State of IT survey of more than 700 IT buyers (Spiceworks, 2018).
- 54% of companies named the need to upgrade outdated IT infrastructure as a driver of their 2026 IT budgets, the most-cited driver, in Spiceworks' 2026 State of IT survey of 835 IT professionals (Spiceworks, 2025).
- 38% of companies planned to decommission unnecessary infrastructure or devices to save costs in 2026, in Spiceworks' 2026 State of IT survey of 835 IT professionals (Spiceworks, 2025).
- 36% of organisations had integrated their on-premises infrastructure with a public cloud, and another 18% planned to, in Spiceworks Ziff Davis' 2022 Hardware Trends survey of more than 1,000 IT professionals (SWZD via ITAM Review, 2022).
Spiceworks' 2019 server survey
- 36% of organisations planned to buy new server hardware within 12 months, and another 25% within one to two years, in Spiceworks' February 2019 survey of 530 IT decision makers (Spiceworks, 2019).
- 68% of enterprises with 1,000 or more employees planned to buy new servers within 12 months in Spiceworks' February 2019 survey, about twice the share of mid-size companies (34%) and small businesses (30%) (Spiceworks, 2019).
- 30% of small businesses (1 to 99 employees) planned to buy new servers within 12 months in Spiceworks' February 2019 survey (Spiceworks, 2019).
- Nearly one-third of organisations said server operating system end of life, such as Windows Server 2008's on 14 January 2020, was prompting them to buy new servers, in Spiceworks' February 2019 survey (Spiceworks, 2019).
- 38% of organisations planning to buy servers cited the maintenance costs of ageing hardware, behind company growth (50%), in Spiceworks' February 2019 survey (Spiceworks, 2019).
- 72% of businesses planned to buy new server hardware within three years, as Spiceworks announced its 2019 State of Servers survey of IT buyers in North America and Europe (Spiceworks via VMblog, 2019).
- Nearly one-third of organisations bought new servers because of Windows Server 2008's end of life, as Network World restated Spiceworks' 2019 finding, which named server OS end of life in general with Server 2008 as the example (Network World, 2019).
How long servers stay in service, and small businesses
- 75% of organisations kept their servers in use for five years or more, in Spiceworks' 2018 survey of 1,372 IT professionals in North America and Europe (Spiceworks, 2018).
- 32% of organisations kept their servers in use for seven years or more, beyond most extended warranties, in Spiceworks' 2018 survey of 1,372 IT professionals (Spiceworks, 2018).
- 37% of companies kept a server in place for seven years or more, as Le Monde Informatique restated Spiceworks' 2018 lifespan survey, which gives 32% (Le Monde Informatique, 2018).
- 29% of businesses using virtual servers kept the physical machines on their own premises and maintained them with internal staff only, in Kaspersky Lab's 2014 survey of more than 2,000 virtualization users (Kaspersky, 2014).
- 17% of businesses using virtual servers relied completely on third-party contractors to house and maintain them, and about 50% used a mix of third-party and in-house hosting and maintenance, in Kaspersky Lab's 2014 survey (Kaspersky, 2014).
- 41% of small businesses using virtual servers stored all of them off-site with a third-party service, against 26% of enterprises, in Kaspersky Lab's 2014 survey (Kaspersky, 2014).
- 33% of small businesses using virtual servers relied completely on their third-party hosting provider to maintain them, against 18% of enterprises, in Kaspersky Lab's 2014 survey (Kaspersky, 2014).
The server market and the data centres
| Firm, period and measure | Figure | Scope |
|---|---|---|
| IDC: server market revenue, 2024 | $235.7 billion | Worldwide server vendor revenue (IDC Worldwide Quarterly Server Tracker) · Worldwide · 2024 |
| IDC: server market revenue, 2025 | $444.1 billion | Worldwide server vendor revenue (IDC Worldwide Quarterly Server Tracker) · Worldwide · 2025 |
| IDC: server revenue, third quarter 2025 | $112.4 billion | Worldwide server vendor revenue (IDC Worldwide Quarterly Server Tracker) · Worldwide · 2025-Q3 |
| IDC: server revenue, first quarter 2026 | $122.6 billion | Worldwide server vendor revenue (IDC Worldwide Quarterly Server Tracker) · Worldwide · 2026-Q1 |
| IDC: server revenue, second quarter 2026 | $166.3 billion | Worldwide server vendor revenue (IDC Worldwide Quarterly Server Tracker) · Worldwide · 2026-Q2 |
| CIO Dive: IDC's first-quarter 2025 figure as first reported | $95.2 billion (revised: $94.1 billion) | Worldwide server vendor revenue (IDC Worldwide Quarterly Server Tracker) · Worldwide · 2025-Q1 |
| Gartner: data-centre systems spending, 2026 forecast | $788 billion (2026 forecast) | Worldwide end-user spending on data center systems (Gartner IT spending forecast) · Worldwide · 2026 |
| Synergy: on-premise share of data-centre capacity, 2024 | 37% | Worldwide data center capacity (Synergy Research Group: hyperscale, colocation and on-premise enterprise data centers) · Worldwide · 2024-Q2 |
| Synergy: on-premise share of data-centre capacity, early 2025 | 34% | Worldwide data center capacity (Synergy Research Group: hyperscale, colocation and on-premise enterprise data centers) · Worldwide · 2025-Q1 |
| Synergy: servers sold into cloud providers' data centres, 2020 | 60% | Worldwide server sales and enterprise data center spending (Synergy Research Group) · Worldwide · 2020 |
- 80% of enterprises would have shut down their traditional data center by 2025, against 10% in 2018, was Gartner analyst Dave Cappuccio's planning assumption published in July 2018 (Gartner, 2018).
- 80% of enterprises would shut down their traditional data centers and move everything to the cloud by 2025, as CIO.com restated Gartner's prediction, dating it to 2019 and adding 'moved everything to the cloud', which the July 2018 original does not say (CIO.com, 2025).
- Gartner's later guidance, quoted in January 2025, reverses the 2018 assumption: its distinguished VP analyst John-David Lovelock said the enterprise data center is here to stay (CIO.com, 2025).
- 52% of large organisations ran containerized applications on-premises or in a private cloud, almost the same as the 53% running them in public cloud, in Nutanix's 2026 Enterprise Cloud Index survey of 1,600 IT and engineering executives (Nutanix, 2026).
- 41% of enterprise workloads ran in some form of public or private cloud in mid-2016, and respondents expected 60% by mid-2018, in 451 Research's survey of more than 1,200 IT professionals as SDxCentral reported it (451 Research via SDxCentral, 2016).
- About 80% of 2,250 IT decision makers expected some repatriation of compute and storage resources within 12 months in IDC's June 2024 survey, as CIO.com reported it (IDC via CIO.com, 2025).
Microsoft's own server business
| Calendar quarter (Microsoft fiscal quarter) | Change | Scope |
|---|---|---|
| April to June 2023 (FY23 Q4) | -1% | Microsoft corporate reporting · Worldwide · 2023-Q2 (April to June 2023, Microsoft FY23 Q4) |
| July to September 2023 (FY24 Q1) | +2% | Microsoft corporate reporting · Worldwide · 2023-Q3 (July to September 2023, Microsoft FY24 Q1) |
| October to December 2023 (FY24 Q2) | +3% | Microsoft corporate reporting · Worldwide · 2023-Q4 (October to December 2023, Microsoft FY24 Q2) |
| January to March 2024 (FY24 Q3) | +6% | Microsoft corporate reporting · Worldwide · 2024-Q1 (January to March 2024, Microsoft FY24 Q3) |
| April to June 2024 (FY24 Q4) | +2% | Microsoft corporate reporting · Worldwide · 2024-Q2 (April to June 2024, Microsoft FY24 Q4) |
| July to September 2024 (FY25 Q1) | -1% | Microsoft corporate reporting · Worldwide · 2024-Q3 (July to September 2024, Microsoft FY25 Q1) |
| October to December 2024 (FY25 Q2) | -3% | Microsoft corporate reporting · Worldwide · 2024-Q4 (October to December 2024, Microsoft FY25 Q2) |
| January to March 2025 (FY25 Q3) | -6% | Microsoft corporate reporting · Worldwide · 2025-Q1 (January to March 2025, Microsoft FY25 Q3) |
| April to June 2025 (FY25 Q4) | -2% | Microsoft corporate reporting · Worldwide · 2025-Q2 (April to June 2025, Microsoft FY25 Q4) |
| July to September 2025 (FY26 Q1) | +1% | Microsoft corporate reporting · Worldwide · 2025-Q3 (July to September 2025, Microsoft FY26 Q1) |
| October to December 2025 (FY26 Q2) | +2% | Microsoft corporate reporting · Worldwide · 2025-Q4 (October to December 2025, Microsoft FY26 Q2) |
| January to March 2026 (FY26 Q3) | slightly up (-3% in constant currency) | Microsoft corporate reporting · Worldwide · 2026-Q1 (January to March 2026, Microsoft FY26 Q3) |
| April to June 2026 (FY26 Q4) | unchanged | Microsoft corporate reporting · Worldwide · 2026-Q2 (April to June 2026, Microsoft FY26 Q4) |

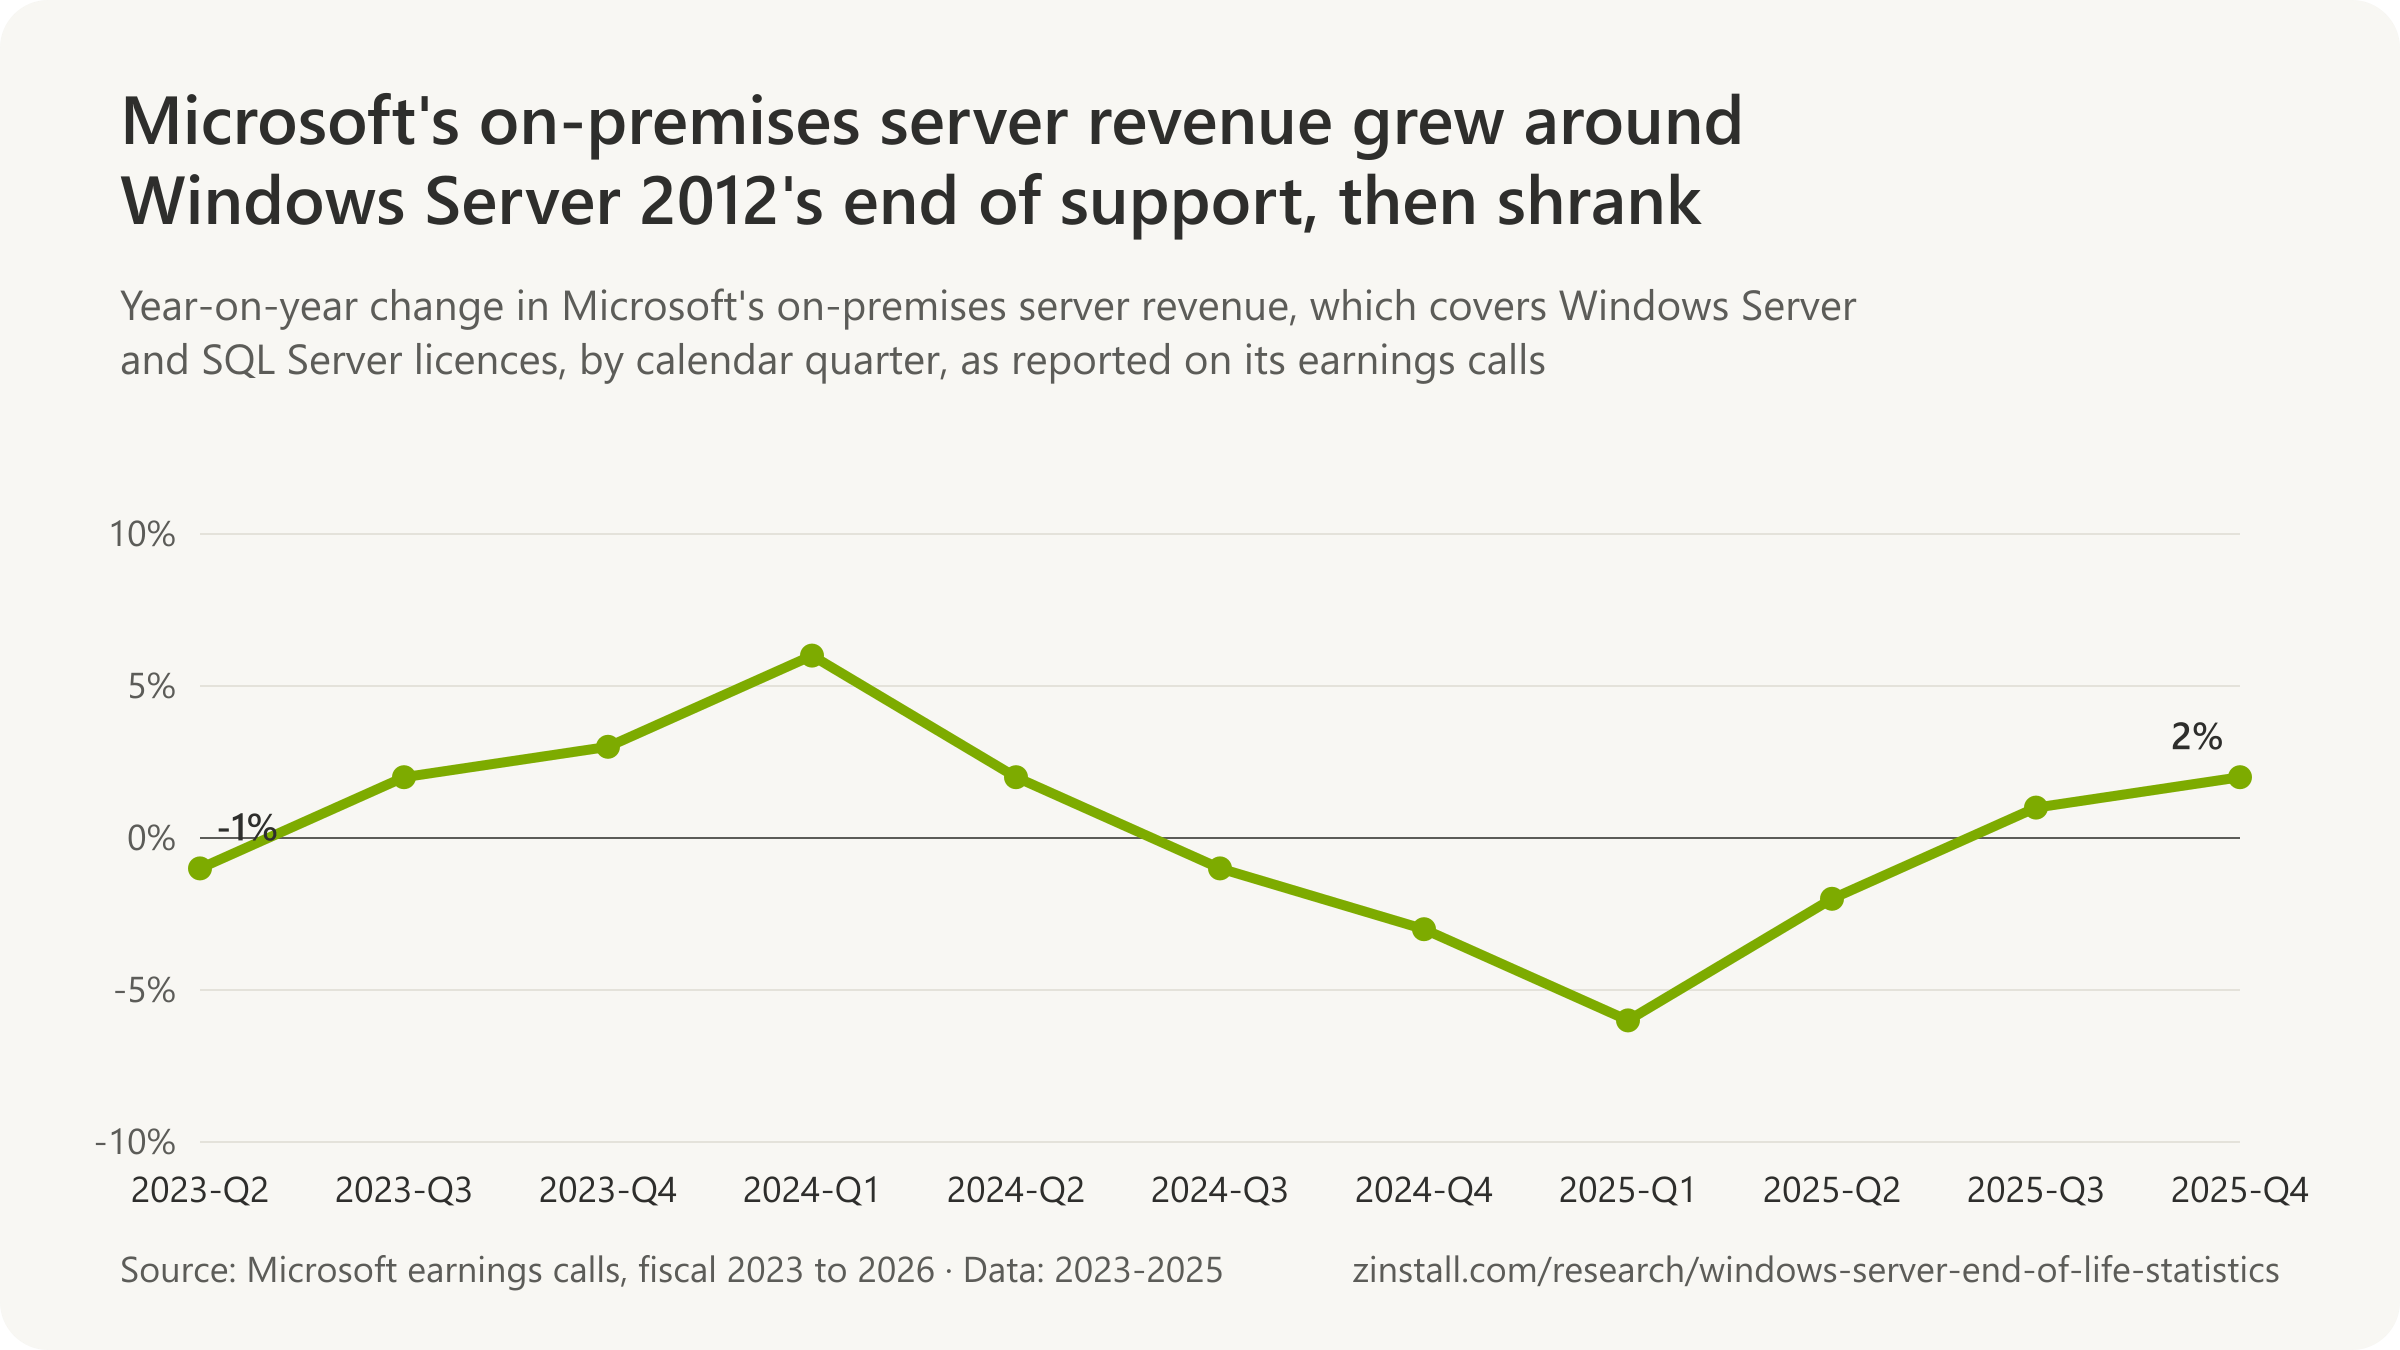
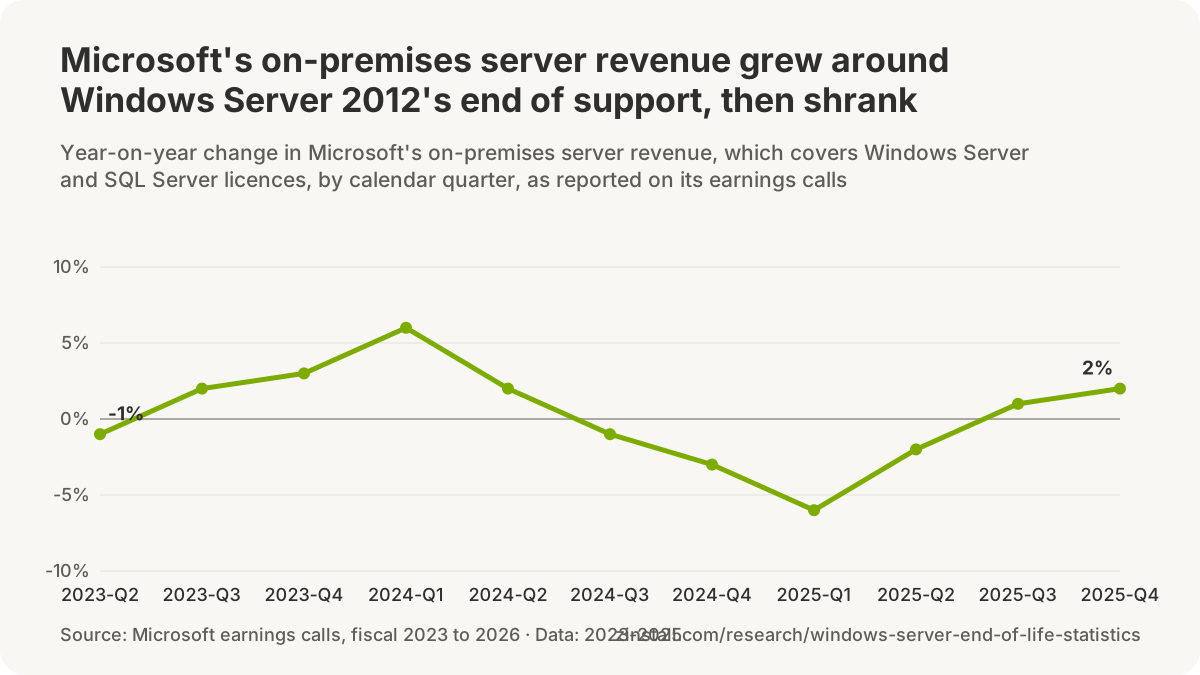
- Microsoft guided its October to December 2024 on-premises server revenue to fall in the low to mid single digits because the prior-year quarter had benefited from purchasing ahead of Windows Server 2012's end of support (Microsoft, 2024).
- 3% was the decline in Microsoft's server products revenue (on-premises Windows Server, SQL Server and related licences) for the fiscal year to June 2025, as customers continued to shift to cloud offerings, while Azure grew 34% (Microsoft, 2025).
- $129.4 billion was Microsoft's server products and cloud services revenue (Azure, SQL Server, Windows Server, Visual Studio, GitHub and Nuance) in the fiscal year to June 2026, nearly 40% of company revenue, as GeekWire read the 10-K (GeekWire, 2026).
- Classic migrations of SQL Server and Windows Server to Azure showed 'good steady state progress' in April 2025, Satya Nadella said on Microsoft's fiscal 2025 third-quarter earnings call (Microsoft, 2025).
- 21% in constant currency is how the Motley Fool's transcript rendered Microsoft's October to December 2025 on-premises server revenue growth, which Microsoft's official transcript gives as up 2% and 1% in constant currency (Motley Fool, 2026).
Sources: Spiceworks (2016-2025); CIO Dive (2017, 2025); Uptime Institute (2021-2026); CIO.com; Network World (2019, 2026); Flexera (2020-2026); eWeek; Spiceworks Ziff Davis; ITAM Review; VMblog; Le Monde Informatique; TechRepublic Premium; Kaspersky Lab; IDC (2025, 2026); Gartner (2018, 2026); Synergy Research Group (2021, 2024, 2025); Nutanix; SDxCentral; Microsoft (2023-2026); GeekWire; The Motley Fool
Windows Server market share against Linux

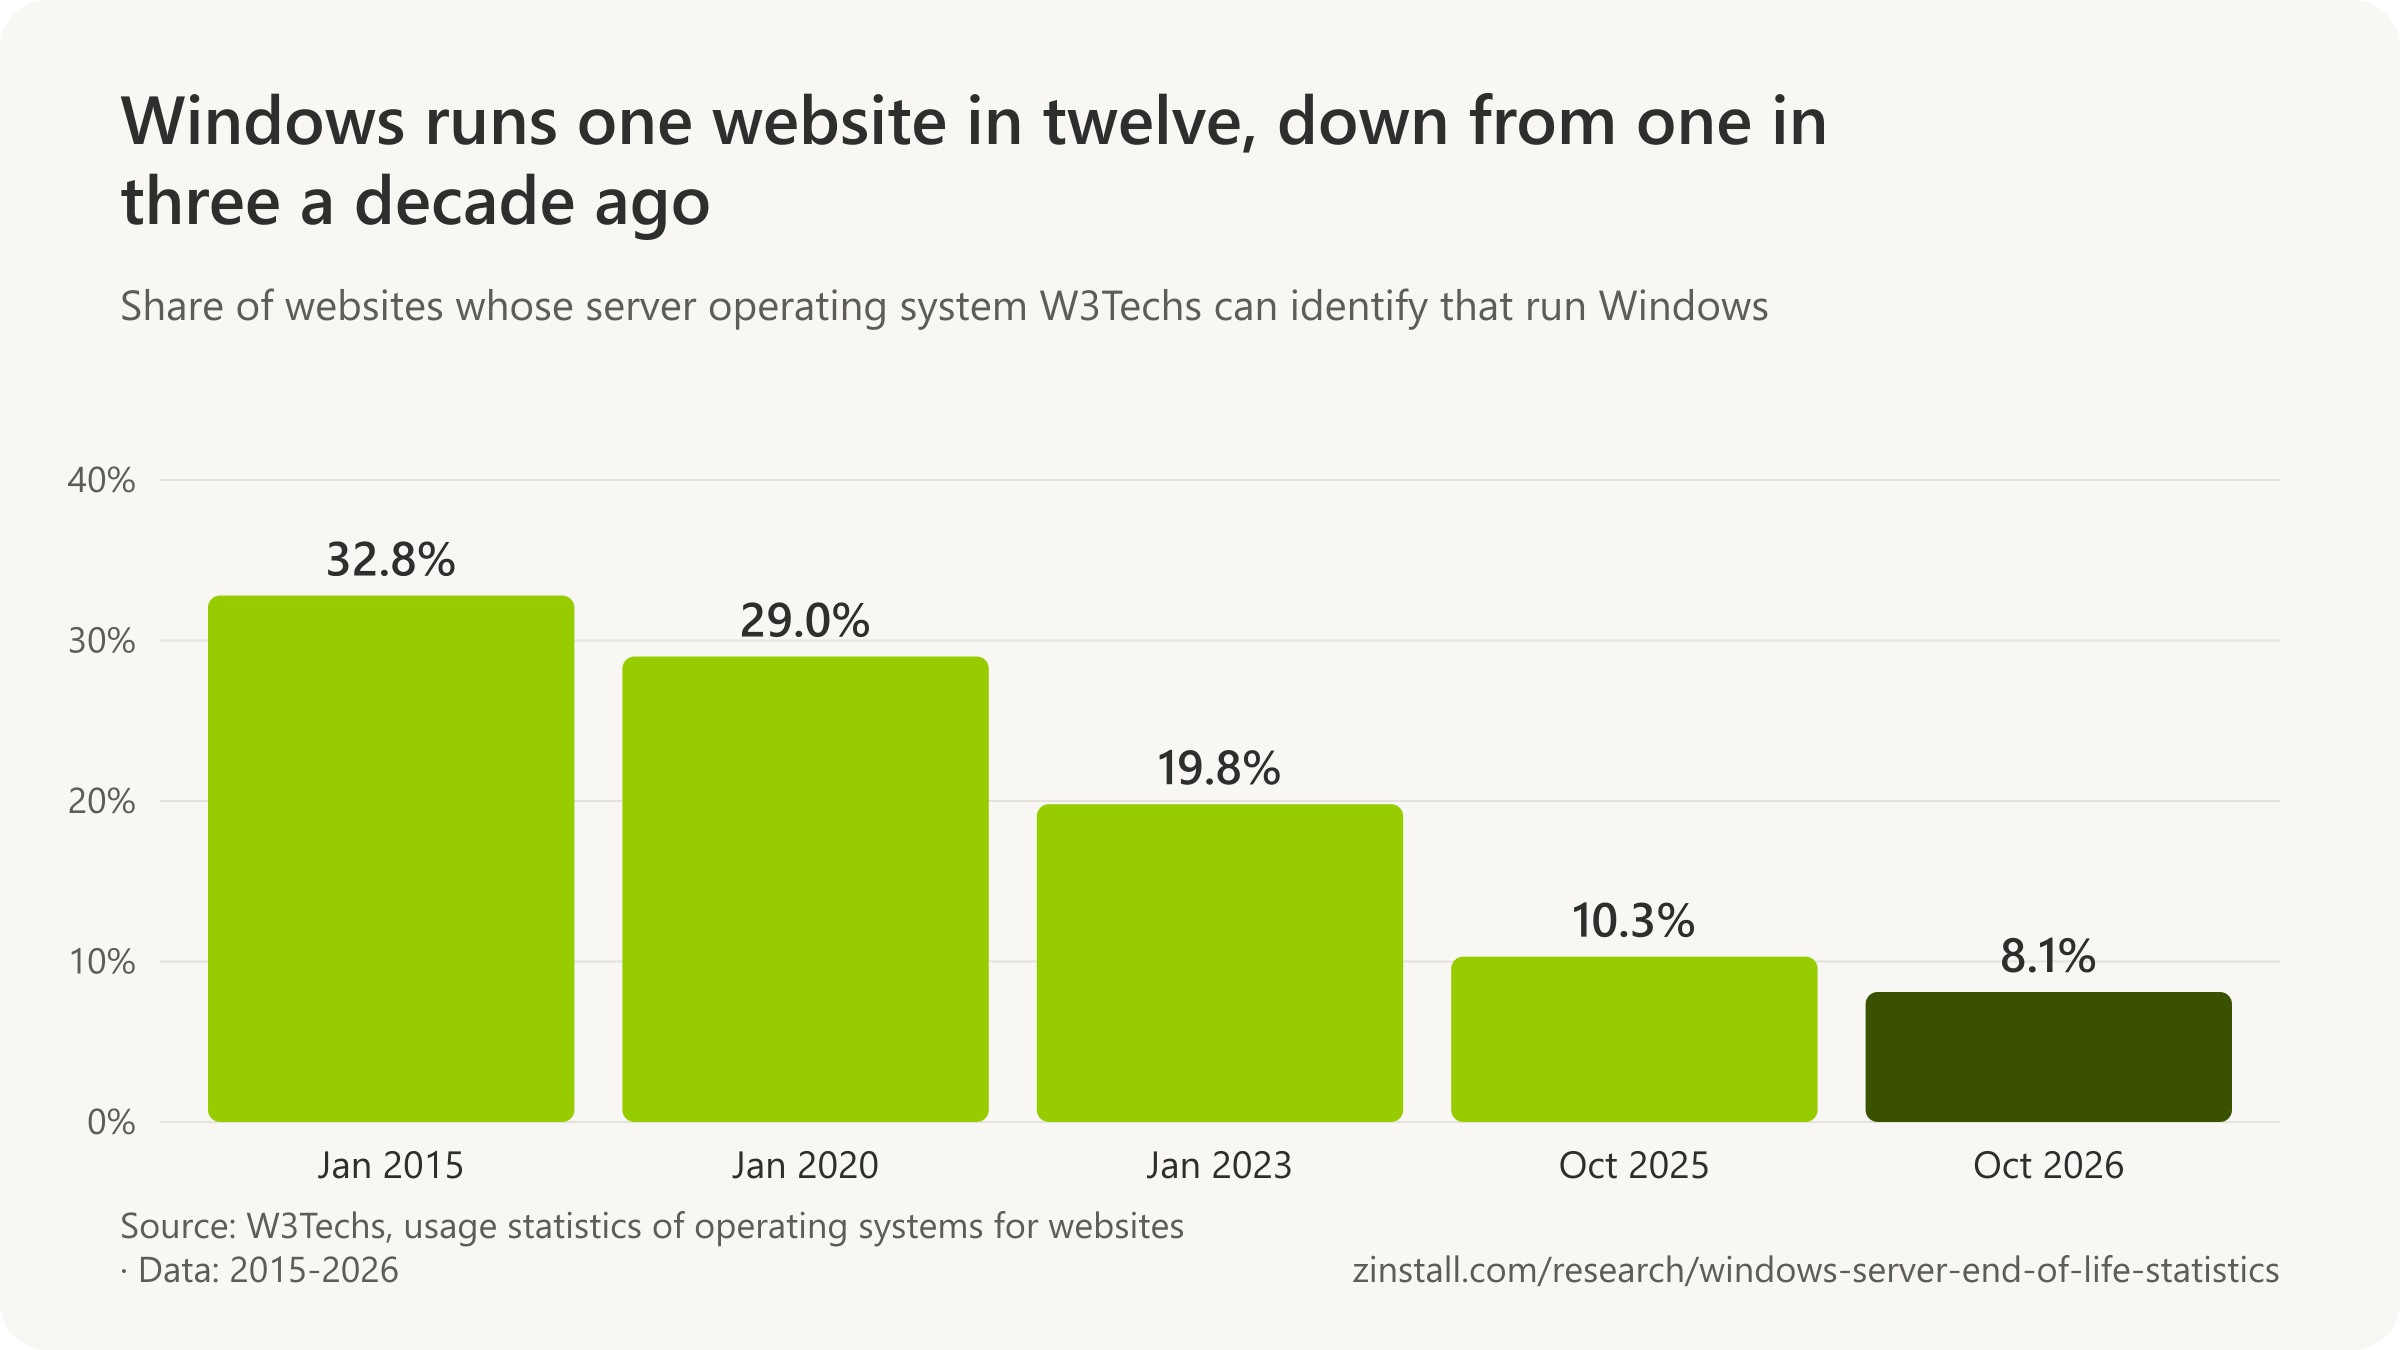
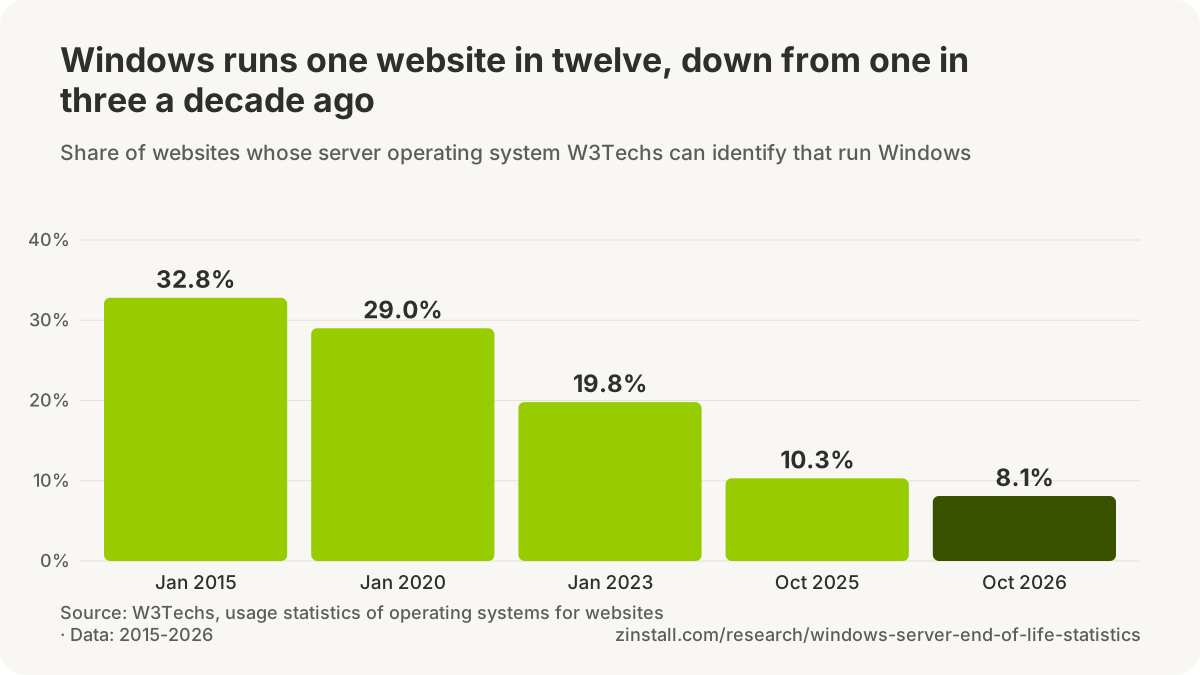
- Windows servers took 42.1% of worldwide server revenue at the end of 2010, the last such share IDC published openly.
- More than two thirds of customer cores on Azure, Microsoft's own cloud, ran Linux in May 2026.
- 847,128 web-facing computers ran Microsoft web server software in July 2026, 5.73% of all.
- AWS said in 2018 that it ran more than 57% of enterprise Windows workloads in the public cloud, citing IDC.
| Date and measure | Share of websites |
|---|---|
| 1 January 2015: Windows as server OS | 32.8% |
| 1 January 2020: Windows as server OS | 29.0% |
| 1 January 2023: Windows as server OS | 19.8% |
| 1 October 2025: Windows as server OS | 10.3% |
| 1 January 2026: Windows as server OS | 9.5% |
| 14 October 2026: Unix-type systems as server OS | 92.1% |
| Change in Windows' share, 2015 to 2026 | -24.7 points |
| 1 January 2015: Microsoft IIS as web server | 13.3% |
| 14 October 2026: Microsoft IIS as web server | 3.0% |
Sources: W3Techs (2026); IDC; Microsoft; Netcraft; Amazon Web Services
More statistics (26)
8.1% of websites whose server operating system W3Techs could determine ran Windows on 14 October 2026, against 92.1% on Unix-type systems (W3Techs, 2026).
Within the Windows estate, the version mix is what the audits in the earlier sections report. Against Linux, the shares come from surveys of the servers that host websites and from Microsoft's and the cloud providers' own statements, which are not the same population as the servers inside a company.
| Date and measure | Share | Scope |
|---|---|---|
| 1 January 2015: Windows as server OS | 32.8% | Websites in W3Techs' survey of the top 10 million sites by Tranco ranking whose server operating system W3Techs can determine (Unix versus Windows only; a site may use more than one OS) · Worldwide (web) · 2015-01-01 |
| 1 January 2020: Windows as server OS | 29.0% | Websites in W3Techs' survey of the top 10 million sites by Tranco ranking whose server operating system W3Techs can determine (Unix versus Windows only; a site may use more than one OS) · Worldwide (web) · 2020-01-01 |
| 1 January 2023: Windows as server OS | 19.8% | Websites in W3Techs' survey of the top 10 million sites by Tranco ranking whose server operating system W3Techs can determine (Unix versus Windows only; a site may use more than one OS) · Worldwide (web) · 2023-01-01 |
| 1 October 2025: Windows as server OS | 10.3% | Websites in W3Techs' survey of the top 10 million sites by Tranco ranking whose server operating system W3Techs can determine (Unix versus Windows only; a site may use more than one OS) · Worldwide (web) · 2025-10-01 |
| 1 January 2026: Windows as server OS | 9.5% | Websites in W3Techs' survey of the top 10 million sites by Tranco ranking whose server operating system W3Techs can determine (Unix versus Windows only; a site may use more than one OS) · Worldwide (web) · 2026-01-01 |
| 14 October 2026: Windows as server OS | 8.1% | Websites in W3Techs' survey of the top 10 million sites by Tranco ranking whose server operating system W3Techs can determine (Unix versus Windows only; a site may use more than one OS) · Worldwide (web) · 2026-10-14 |
| 14 October 2026: Unix-type systems as server OS | 92.1% | Websites in W3Techs' survey of the top 10 million sites by Tranco ranking whose server operating system W3Techs can determine (Unix versus Windows only; a site may use more than one OS) · Worldwide (web) · 2026-10-14 |
| Change in Windows' share, 2015 to 2026 | -24.7 points | Websites in W3Techs' survey of the top 10 million sites by Tranco ranking whose server operating system W3Techs can determine (Unix versus Windows only; a site may use more than one OS) · Worldwide (web) · 2015-01-01/2026-10-14 |
| 1 January 2015: Microsoft IIS as web server | 13.3% | Websites in W3Techs' survey of the top 10 million sites by Tranco ranking whose web server software W3Techs can determine (a site may use more than one web server) · Worldwide (web) · 2015-01-01 |
| 14 October 2026: Microsoft IIS as web server | 3.0% | Websites in W3Techs' survey of the top 10 million sites by Tranco ranking whose web server software W3Techs can determine (a site may use more than one web server) · Worldwide (web) · 2026-10-14 |

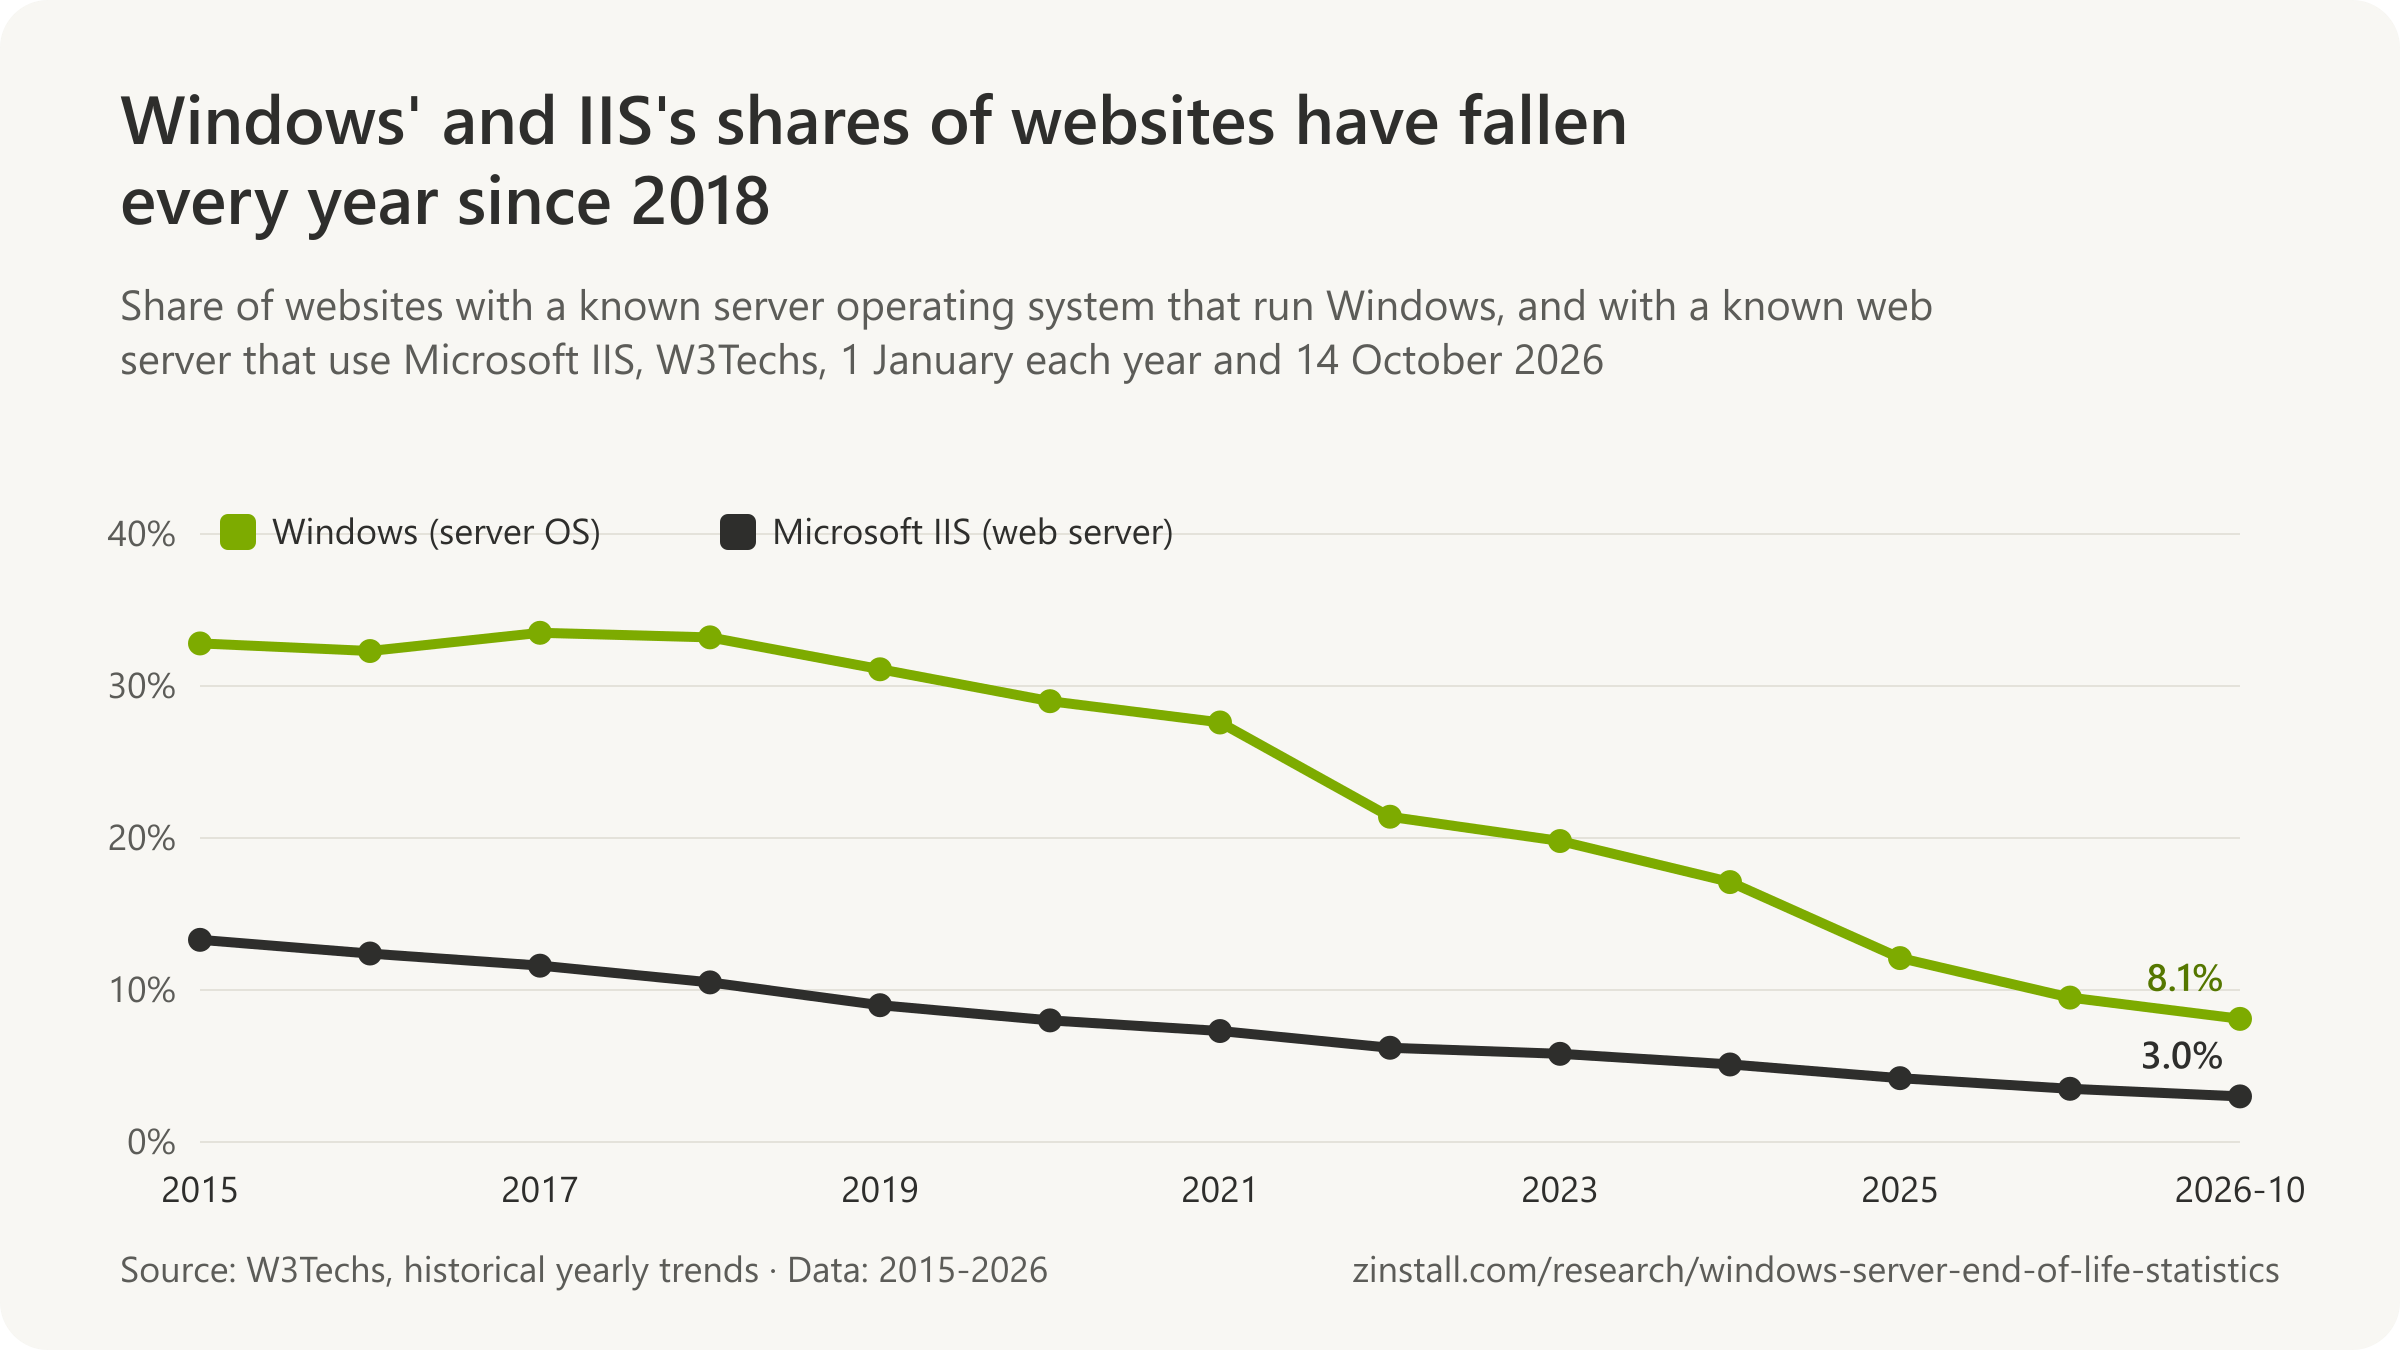
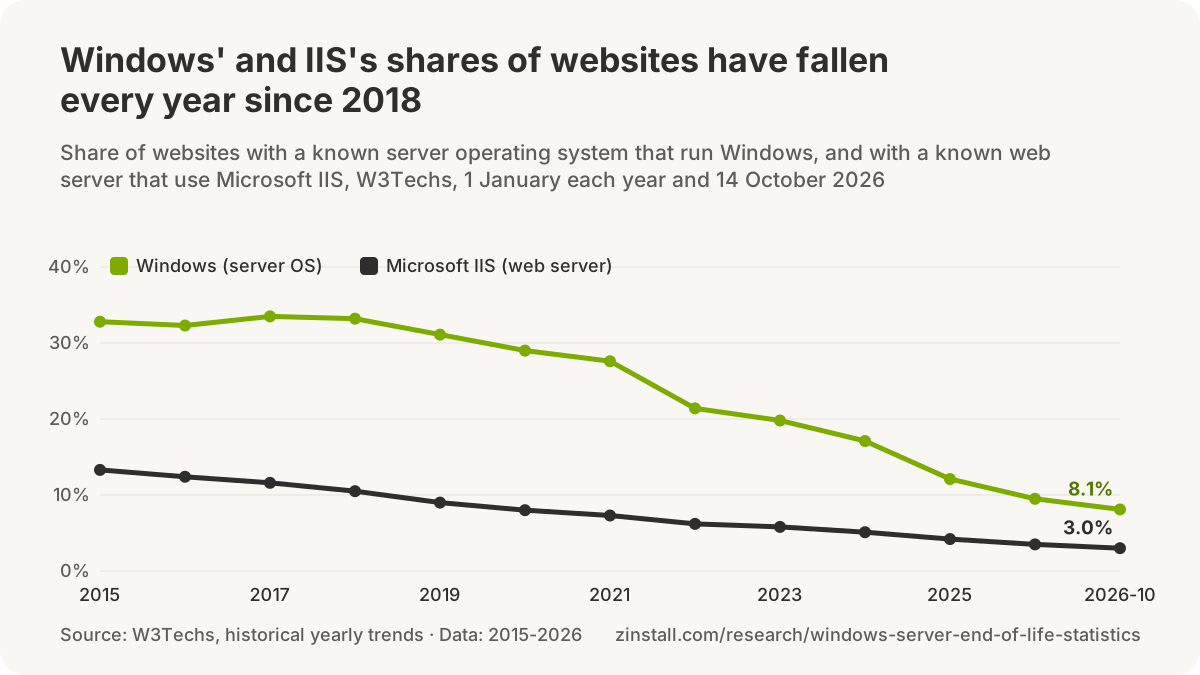
| Survey month and measure | Figure | Scope |
|---|---|---|
| July 2025: computers running Microsoft web server software | 1,113,303 | Web-facing computers counted by Netcraft's monthly Web Server Survey (unique computers acting as web servers, identified from low-level TCP/IP characteristics), by web server developer · Worldwide (web) · 2025-07 |
| July 2026: computers running Microsoft web server software | 847,128 | Web-facing computers counted by Netcraft's monthly Web Server Survey (unique computers acting as web servers, identified from low-level TCP/IP characteristics), by web server developer · Worldwide (web) · 2026-07 |
| Change, July 2025 to July 2026 | -23.9% | Web-facing computers counted by Netcraft's monthly Web Server Survey (unique computers acting as web servers, identified from low-level TCP/IP characteristics), by web server developer · Worldwide (web) · 2025-07/2026-07 |
- 42.1% of worldwide server factory revenue in the fourth quarter of 2010 came from Windows servers ($6.3 billion), whose 1.5 million shipments were the highest quarterly total IDC had recorded for Windows (IDC, 2011).
- 17.0% of worldwide server revenue in the fourth quarter of 2010 came from Linux servers ($2.5 billion), up 1.8 points on a year earlier, against 42.1% for Windows servers (IDC, 2011).
Windows Server in the public cloud
- 60%+ of Azure customer compute cores were Linux-based in February 2022, with Linux virtual-machine cores growing faster than Windows ones, by Microsoft's own statement (Microsoft, 2022).
- 60%+ of Azure customer cores ran Linux-based workloads in October 2024, making Linux 'the most popular operating system on Azure' by Microsoft's own statement (Microsoft, 2024).
- More than two-thirds of Azure customer cores ran Linux in May 2026, up from 'more than 60%' in 2022 and 2024, by Microsoft's own statement at Open Source Summit North America (Microsoft, 2026).
- 57%+ of enterprise Windows workloads in the public cloud ran on AWS, twice the next provider, AWS wrote in November 2018 citing IDC, the origin of its 'more Windows than any other cloud' claim (AWS, 2018).
- Nearly 2x more Windows Server instances than the next largest cloud provider is what AWS claimed to run on its Windows page in June 2020, citing an unnamed IDC report (AWS, 2020).
- 5x growth in the number of AWS enterprise customers using Amazon EC2 for Windows Server between 2015 and 2020 is what AWS claimed on its Windows page in June 2020 (AWS, 2020).
- 98% less unplanned downtime, 71% faster deployment and 26% higher developer productivity is what AWS attributed to IDC for customers moving Microsoft workloads to AWS, on its Windows page in December 2023 (AWS, 2023).
- 18 years (since 2008) is how long AWS says it has run Microsoft workloads, 'longer than anyone else', on its Windows page in October 2026, where the earlier 'nearly 2x more Windows Server instances' claim no longer appears (AWS, 2026).
- 32% to 88% lower licensing and hardware costs, depending on workload, is what Google Cloud attributed to an Enterprise Strategy Group study of its customers who moved Windows Server workloads to Google Cloud in December 2020 (Google Cloud, 2020).
- 32% lower three-year total cost of ownership is the maximum Google Cloud modelled for 520 Windows Server 2016 workloads on sole-tenant nodes with bring-your-own-licence, citing an ESG study in December 2020 (Google Cloud, 2020).
- 0 quantitative claims about Windows Server workloads (customer counts, shares or market position) appear on Google Cloud's 'Microsoft and Windows' page as of October 2026, against AWS's '2x' and 'longer than anyone else' claims (Google Cloud, 2026).
Sources: W3Techs (2026); Netcraft (2025, 2026); IDC; Microsoft (2022, 2024, 2026); Amazon Web Services (2018-2026); Google Cloud (2020, 2026)
How much does an ageing server cost, and how long do servers last?
A server costs $22,511 a year to run in years four to six, up 199%, in a vendor-sponsored survey (IDC for Dell and Intel, 2021).

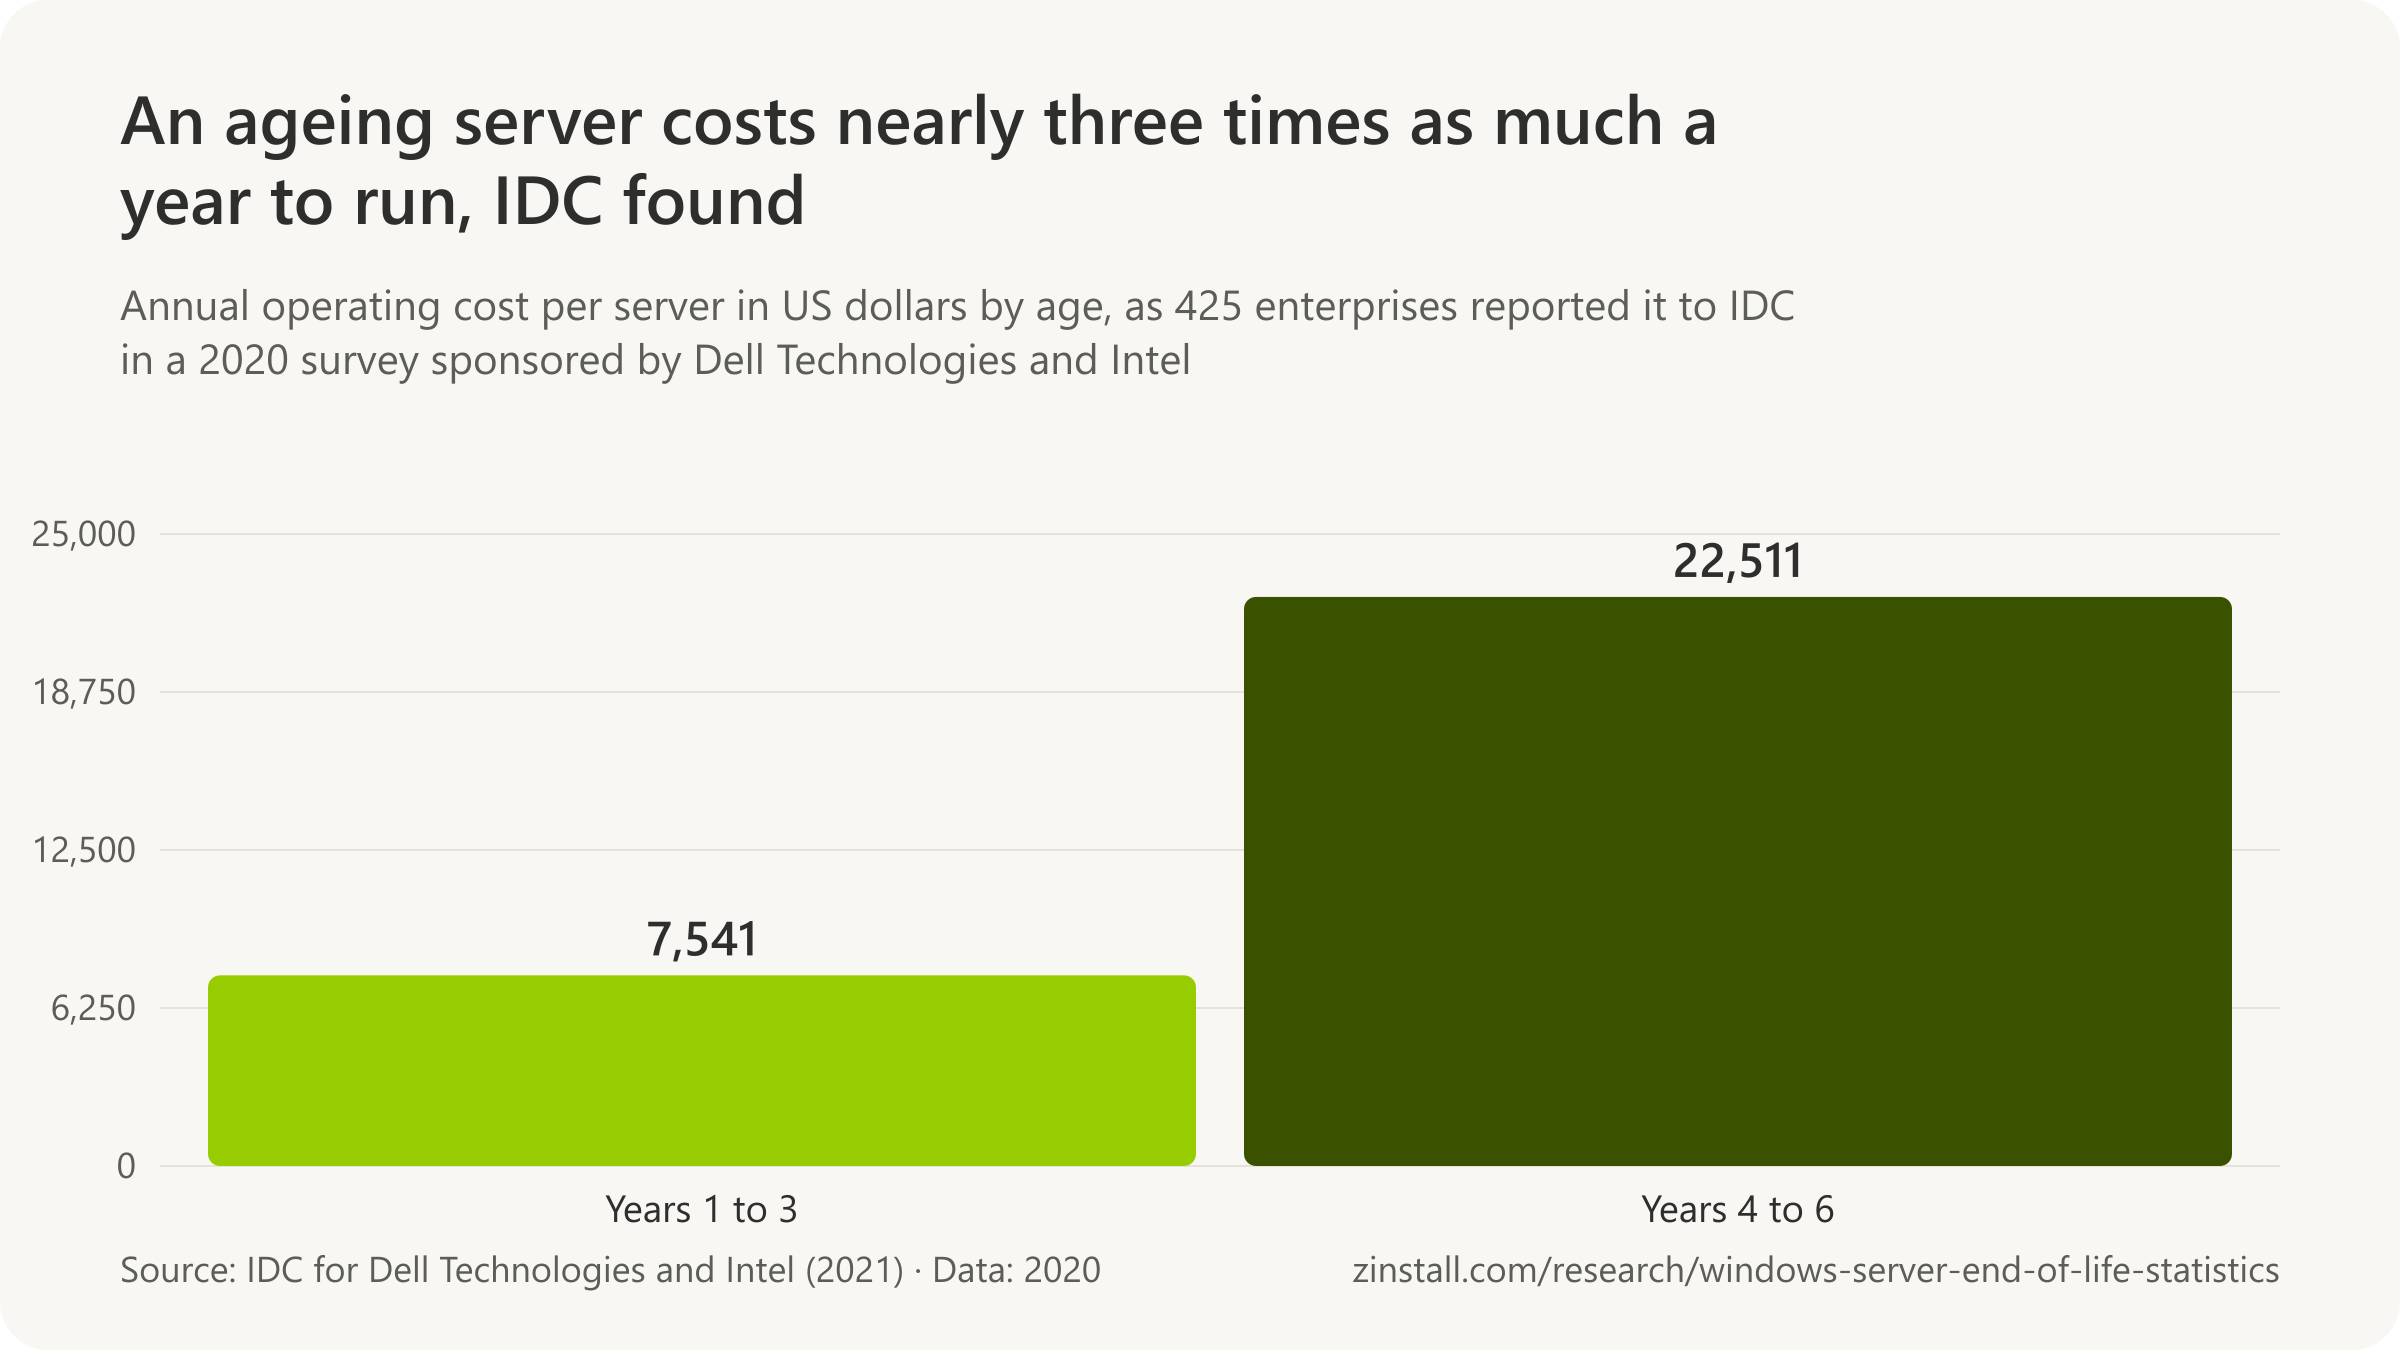
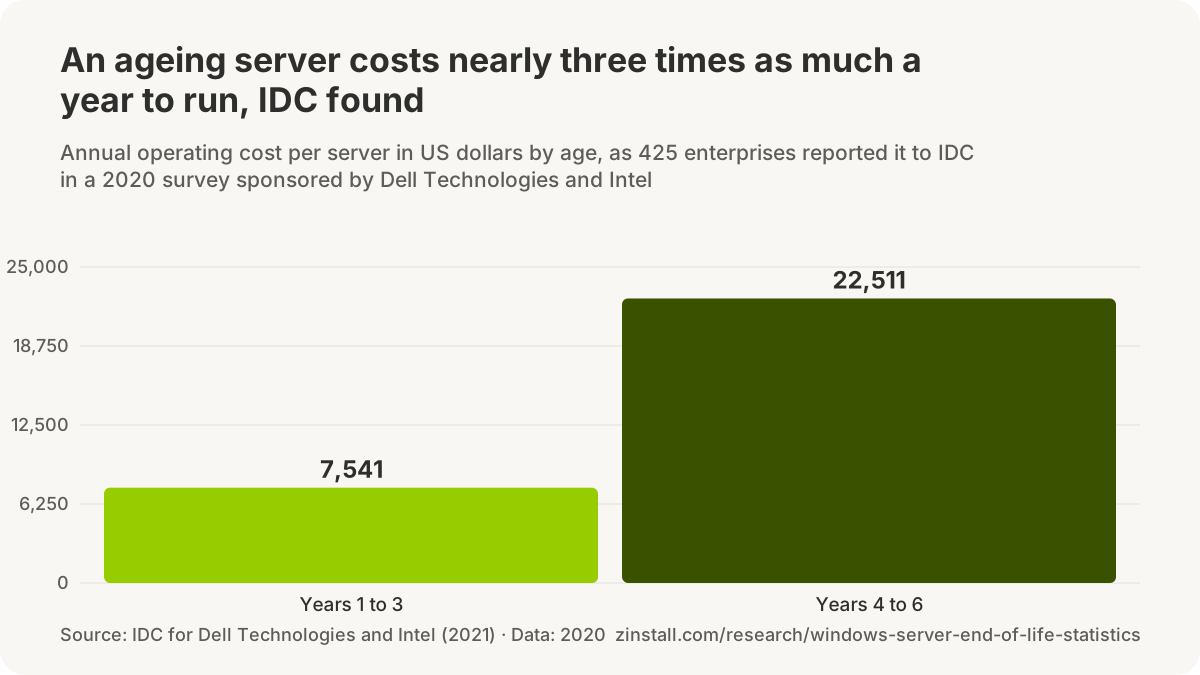
- Enterprises that waited until a server's sixth year reported 162% more unplanned downtime.
- A three-year replacement cycle cut the cost of running servers by 22% against a six-year one, in IDC's model.
- Since fiscal 2023, Microsoft has estimated its own servers' useful life at 6 years, up from four.
- 33% of data-centre operators refreshed their servers every three years or less in 2026.
- Spiceworks put the cost of leaving Windows Server 2003 at $100 billion across businesses, in 2015.
| Survey, date and measure | Figure |
|---|---|
| IDC, 2017: mean server life cycle | 5.15 years |
| IDC: servers on a five-year cycle, 2016 | 32.9% (from 48.7%) |
| IDC, 2017: servers kept five or six years | 60.2% |
| IDC for Dell and Intel, 2020: replacing every five years or more | 53% |
| IDC for Dell and Intel, 2025: refreshing every three years or less | 44% |
| IDC for Dell and Intel, 2025: waiting three to five years | Half |
| Uptime Institute, 2022: keeping servers five years or longer | 52% (from 34%) |
| Uptime Institute, 2026: refreshing every six years or more | 18% |
| Omdia, 2022: useful life at North American enterprises | 5.4 years |
| Omdia, 2022: the longest most enterprises keep a server | 7 years |
Sources: IDC (2025, 2021, 2018); Microsoft; Uptime Institute; eWeek; Network World; Data Center Knowledge
More statistics (47)
$22,511 a year per server was the operating cost enterprises expected in years four to six of a server's life, up 199% from $7,541 in years one to three, in IDC's survey of 425 enterprises for Dell and Intel (IDC for Dell and Intel, 2021).
Few surveys measure a server migration end to end. What exists are migration budgets, vendor-commissioned studies of what an old server costs to keep or a move saves, the cloud operators' own accounting for how long a server lasts, and surveys of how long companies keep theirs, each labelled with who paid for it.
| Survey, date and measure | Figure | Scope |
|---|---|---|
| IDC, 2017: mean server life cycle | 5.15 years | Respondents to IDC's Server and Storage Workloads Survey: Understanding 3rd Platform Usage (May 2017), estimating how long servers bought in 2016 would stay in operation · Worldwide (IDC survey) · 2017-05 |
| IDC: servers on a five-year cycle, 2016 | 32.9% (from 48.7%) | Respondents to IDC's Server and Storage Workloads Survey, 2010 to 2016 editions · Worldwide (IDC survey) · 2016 |
| IDC, 2017: servers kept five or six years | 60.2% | Respondents to IDC's Server and Storage Workloads Survey (May 2017), estimating the life of servers purchased in 2016 · Worldwide (IDC survey) · 2017-05 |
| IDC for Dell and Intel, 2020: replacing every five years or more | 53% | Enterprise respondents (organisations with more than 500 employees, n = 425) to IDC's web survey of 707 IT practitioners and decision-makers for Dell and Intel ('Dell EMC Server Upgrade 2020 Research'); a Dell brochure says respondents used Dell server solutions across seven industries · Not stated (USD values) · 2020 |
| IDC for Dell and Intel, 2025: refreshing every three years or less | 44% | IT decision-makers at US organisations with at least 1,000 employees, IDC's Intel-Dell Server Refresh and Upgrade Survey, March 2025 (n = 199 for this question in the white paper; 200 respondents in the May 2025 InfoBrief) · United States · 2025-03 |
| IDC for Dell and Intel, 2025: waiting three to five years | Half | IT decision-makers at US organisations with at least 1,000 employees, IDC's Intel-Dell Server Refresh and Upgrade Survey, March 2025 (n = 199 for this question in the white paper; 200 respondents in the May 2025 InfoBrief) · United States · 2025-03 |
| Uptime Institute, 2022: keeping servers five years or longer | 52% (from 34%) | Respondents to Uptime Institute's Global Data Center Survey 2022 (and 2015 edition) · Worldwide · 2022 |
| Uptime Institute, 2026: refreshing every three years or less | 1 in 3 | Data center owner/operator respondents to Uptime Institute's 2026 Global Data Center Survey, fielded 17 March to 1 May 2026 (n = 659 for this question; 801 owner/operators of 1,635 respondents) · Worldwide · 2026-05 |
| Uptime Institute, 2026: refreshing every six years or more | 18% | Data center owner/operator respondents to Uptime Institute's 2026 Global Data Center Survey, fielded 17 March to 1 May 2026 (n = 659 for this question; 801 owner/operators of 1,635 respondents) · Worldwide · 2026-05 |
| Omdia, 2022: useful life at North American enterprises | 5.4 years | North American enterprises in Omdia's annual survey (sample size not reported) · North America · 2022 |
| Omdia, 2022: the longest most enterprises keep a server | 7 years | Analyst expectation drawn from Omdia's survey of North American enterprises · North America · 2022 |
| Company | Years | Scope |
|---|---|---|
| Microsoft, from fiscal 2023 | 6 years (from 4) | Microsoft's own server and network equipment (accounting estimate) · Worldwide (Microsoft's fleet) · 2022-07 |
| Alphabet, from 2023 | 6 years | Alphabet's own servers and certain network equipment (accounting estimate) · Worldwide (Google's fleet) · 2023-01 |
| Meta, from 2025 | 5.5 years | Certain Meta servers and network assets (accounting estimate) · Worldwide (Meta's fleet) · 2025-01 |
| Amazon (a subset), from 2025 | 5 years (from 6) | A subset of Amazon's own servers and networking equipment (accounting estimate) · Worldwide (Amazon's fleet) · 2025-01 |

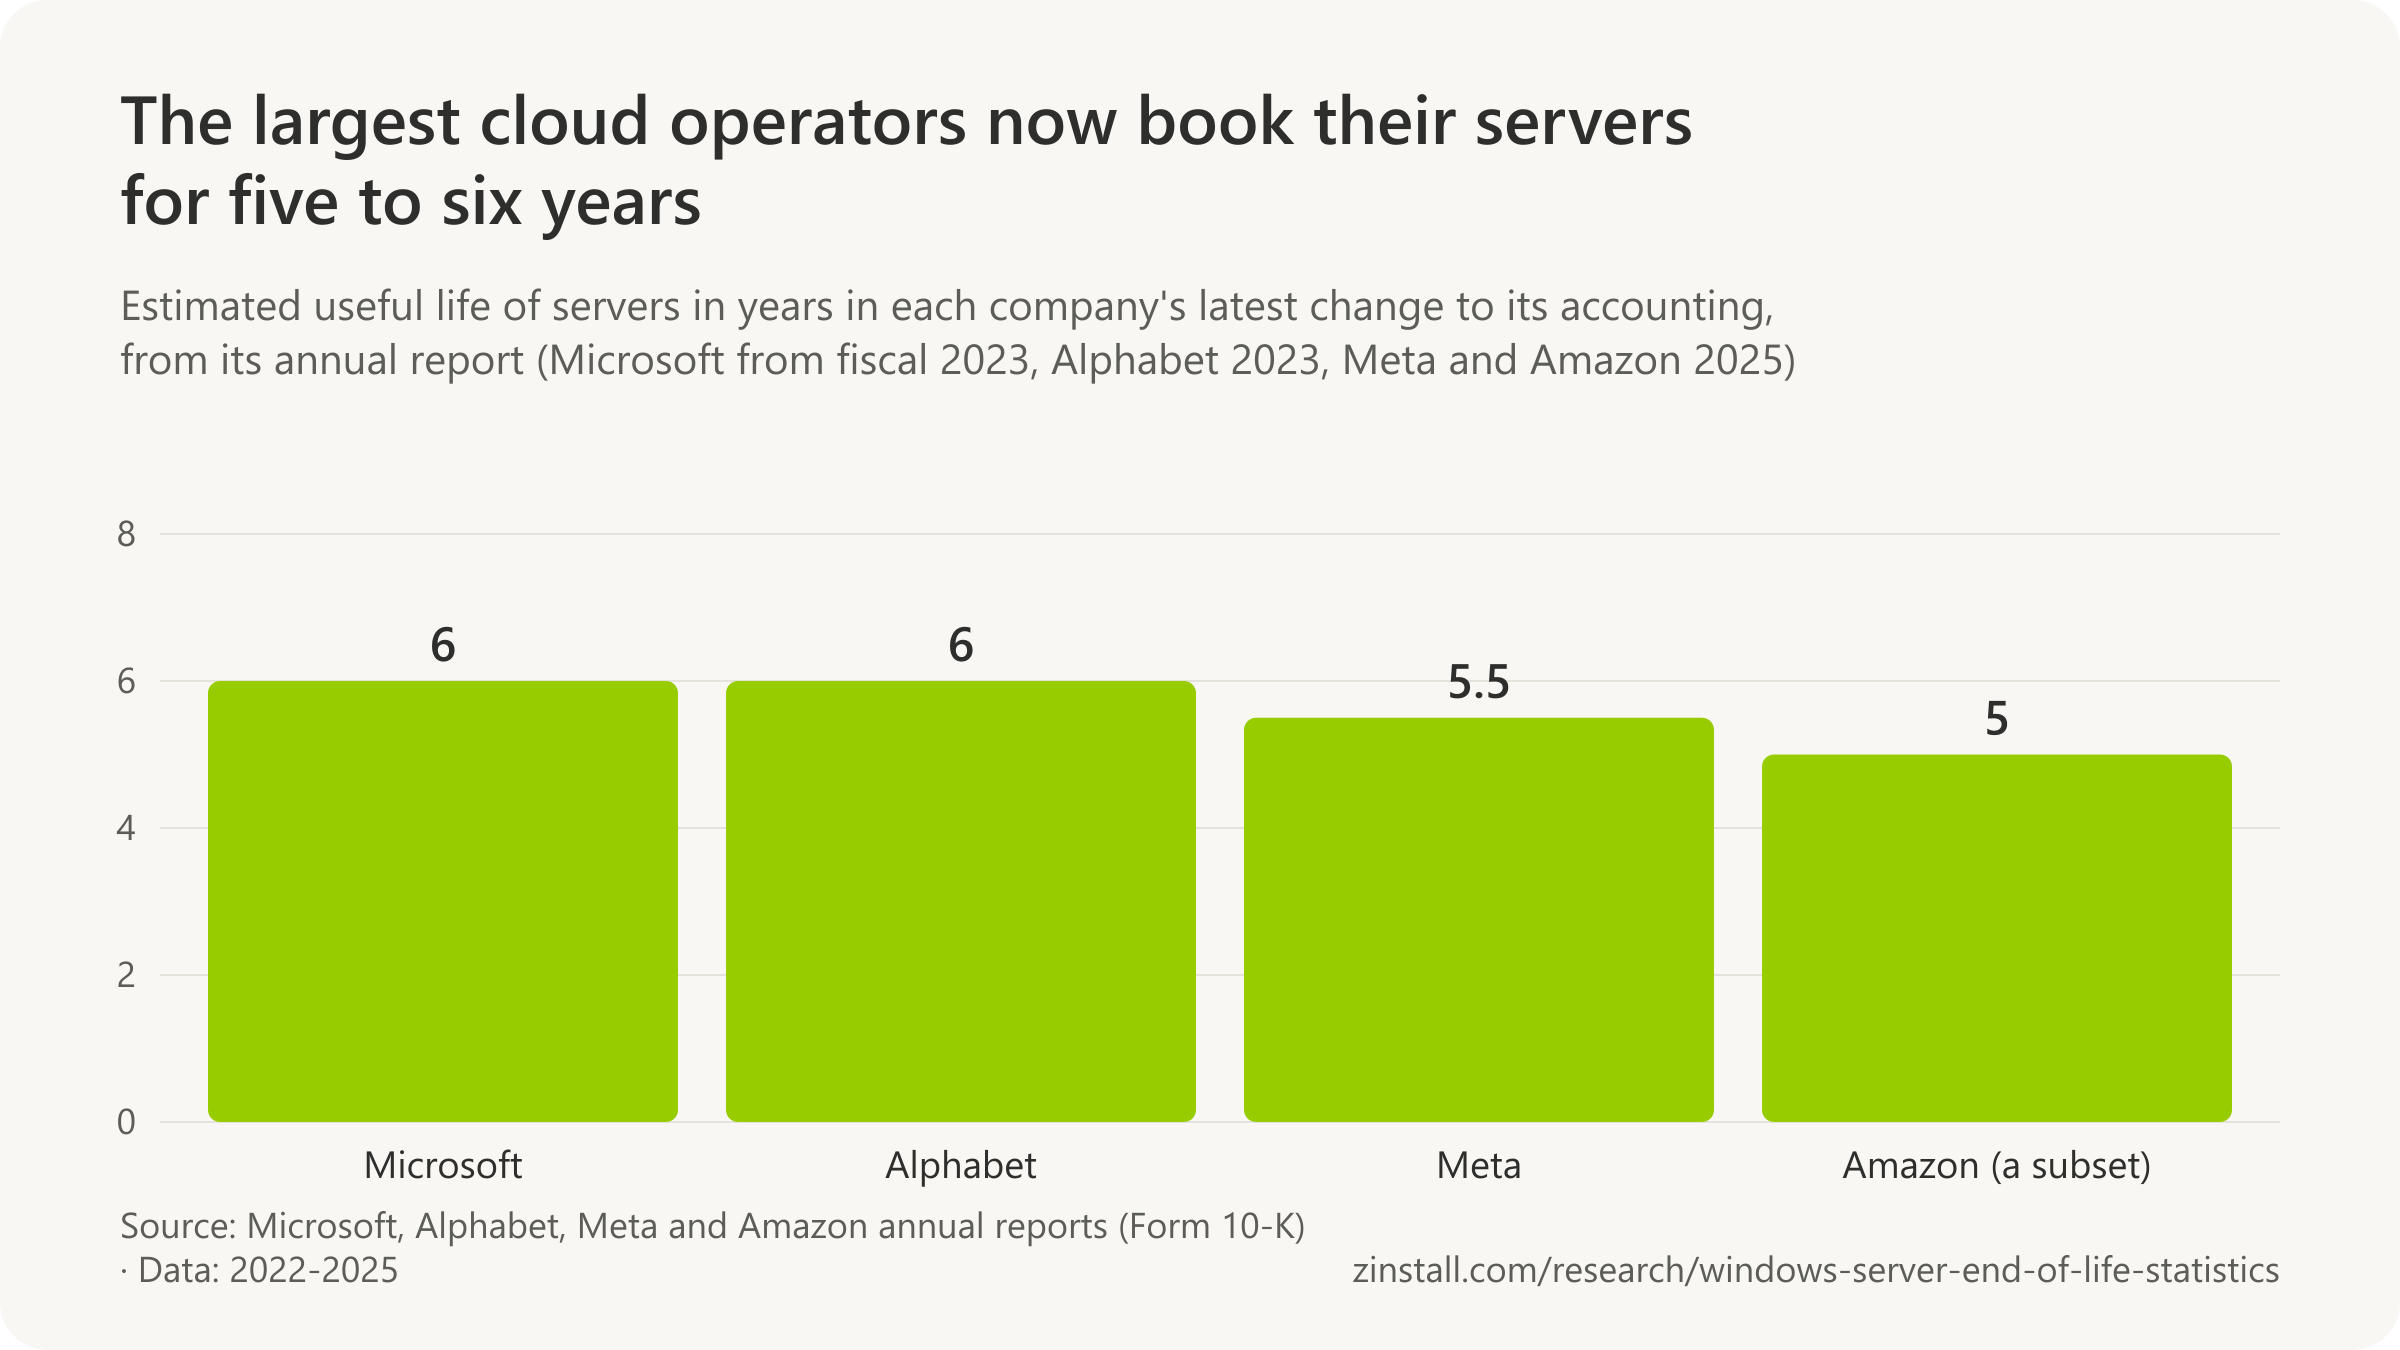
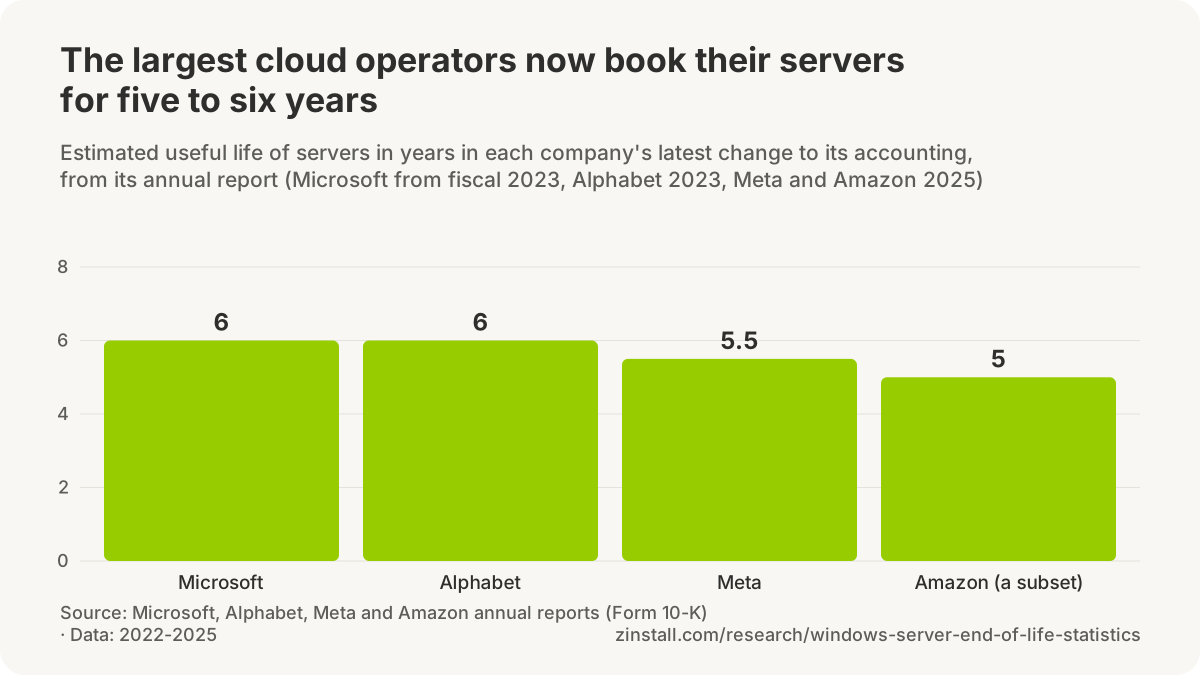
- 162% more unplanned downtime was reported by the average enterprise that waited until a server's sixth year to replace it, in IDC's 2020 survey of 425 enterprises for Dell and Intel (IDC for Dell and Intel, 2021).
- 22% lower total cost of ownership for server operations comes from a three-year rather than a six-year replacement cycle, in IDC's model of a 1,000-employee company running 200 applications on 27 servers, for Dell and Intel (IDC for Dell and Intel, 2021).
- Over 40% of organisations say they have refreshed or upgraded their server equipment more frequently since the COVID-19 pandemic, in IDC's March 2025 survey sponsored by Dell Technologies and Intel (IDC for Dell and Intel, 2025).
- 35% of organisations refresh on-premises servers to avoid costly support contracts for end-of-life equipment, behind security (48%) and performance (47%), in IDC's March 2025 survey of 199 organisations sponsored by Dell Technologies and Intel (IDC for Dell and Intel, 2025).
- 20% more processing power for the same watts is what upgrading a 2015 dual-socket server in 2019 might give, against 200% to 300% for upgrading a 2008/2009 server in 2012, in Uptime Institute's analysis of SPECpower results (Uptime Institute, 2020).
- 75% of the time, on average, is how long servers in real deployments sit in idle mode, which Uptime Institute says weakens the energy case for refreshing recent hardware (Uptime Institute, 2020).
- 85% higher failure rates for servers kept past their makers' recommended replacement point is an IDC finding as restated by TechRadar in 2013, which also quotes IDC recommending a refresh at about 3.2 years; the IDC paper is not named (TechRadar, 2013).
- 14% a year is how fast server performance erodes, according to IDC research restated by TechTarget in 2020, which adds that a five-year-old server performs 40% below new; the IDC document is not named (TechTarget, 2020).
- 20% more unplanned downtime a year comes from older, slower and less reliable servers, according to IDC as restated by TechTarget in 2020; the IDC document is not named (TechTarget, 2020).
What vendors say a refresh or a move saves
- 270% three-year risk-adjusted ROI was Forrester's estimate for a composite 15,000-employee organisation upgrading to Windows Server 2012 R2 from 2008 or 2012, in a study Microsoft commissioned in 2014 from six customer interviews (Forrester for Microsoft, 2014).
- 6 months was the payback period Forrester estimated for a composite 15,000-employee organisation upgrading to Windows Server 2012 R2, in a Microsoft-commissioned 2014 study built from six customer interviews (Forrester for Microsoft, 2014).
- 435% ROI over five years, a $22.4 million net present value, was Forrester's modelled result for moving infrastructure to Azure IaaS, in a June 2017 study commissioned by Microsoft from six customer interviews, as abridged by a Microsoft partner (Forrester for Microsoft, 2017).
- 304% three-year ROI, with payback in under six months, was Forrester's modelled result for a composite enterprise managing 1,000 Windows Servers and other assets with Azure Arc, in an April 2025 study commissioned by Microsoft from four interviews (Forrester for Microsoft, 2025).
- 30% lower Extended Security Update fees per server, on an assumed $480 per server, was Forrester's modelled saving for a composite enterprise with 1,000 Windows Servers buying ESU through Azure Arc instead of multi-vendor procurement, in an April 2025 study commissioned by Microsoft (Forrester for Microsoft, 2025).
- 35% lower cloud spending in Year 1 was Forrester's modelled result for a composite enterprise with $12.5 million of annual Azure spend that used Microsoft's cost tools and pricing offers, including Azure Hybrid Benefit, in a June 2025 study commissioned by Microsoft (Forrester for Microsoft, 2025).
- $15.85 million in total annual benefits was what companies that moved Windows Server and SQL Server workloads to Azure gained, by Microsoft's 2024 summary of a September 2022 IDC study it commissioned (Microsoft, 2024).
- More than $100,000 per server of additional business was the average value of performance and agility gains from server refreshes in IDC's July 2018 Business Value study with Dell, as cited in IDC's November 2018 Perspective (IDC for Dell, 2018).
- 71%, or $740,731 over four years, was the saving a large manufacturer projected from replacing 20 four-year-old HPE servers with four Lenovo ThinkSystem SR950 servers running Windows Server 2016, in a 2017 Lenovo case study (Lenovo, 2017).
- 90%, or $617,040 over four years, of Windows Server 2016 Datacenter and VMware vSphere maintenance cost was the saving projected from running on four new servers instead of 20 old ones, in a 2017 Lenovo case study (Lenovo, 2017).
- 15% to 40% baseline performance gain with each new server generation is Lenovo's claim in its 2017 paper on refreshing four-socket servers (Lenovo, 2017).
- 82% less hands-on deployment time, just over 3 minutes against just over 20, was Principled Technologies' result for a Dell EMC PowerEdge R740 shipped with Windows Server 2016 pre-installed versus installing it manually, in a 2018 test for Dell EMC (Principled Technologies, 2018).
- $222 per server (25% of a $882 licence cost) was the saving Principled Technologies found from buying a Dell EMC PowerEdge R740 with Windows Server 2016 Standard pre-installed rather than licensing it separately, in a 2018 test for Dell EMC (Principled Technologies, 2018).
- $223 is the licence saving Principled Technologies' own press release gave for its 2018 Dell EMC pre-installed Windows Server test, against $222 ($222.20 in the table) in the report itself (Principled Technologies via PR.com, 2018).
What a migration project takes
- $100 billion of migration-related spending on hardware, software, cloud and services was Spiceworks' extrapolation of what leaving Windows Server 2003 would cost businesses, from its January 2015 survey of 1,300 IT professionals (Spiceworks via eWeek, 2015).
- 20 hours of IT preparation on average was the top tier's investment in a Windows 7 migration, against nine hours for the bottom tier, among more than 1,300 IT managers surveyed by Symantec in 2010 (Symantec, 2010).
- 2 hours offline was the user downtime at organisations whose IT spent 20 hours preparing for Windows 7, against 6 hours where IT spent nine hours, among more than 1,300 IT managers surveyed by Symantec in 2010 (Symantec, 2010).
- More than 80% of companies said planning helped their Windows 7 migration and minimised its cost, among more than 1,300 IT managers surveyed by Symantec in 2010 (Symantec, 2010).
- 5% of managed service providers expected their clients' on-premises server use to increase over the next three years, in Datto's 2021 survey of 1,884 MSPs worldwide (Datto, 2021).
- Half of managed service providers expected 75% of their clients' workloads to be in the public cloud within three years, in Datto's 2022 Global State of the MSP survey of 1,800 MSPs (Datto, 2022).
- 12.9% was the average project services gross margin of managed service providers in Q4 2024, down from 23% a year earlier as project work dropped, in ConnectWise's Service Leadership Index (ConnectWise, 2025).
- 19.4% was the average project and professional services gross margin of managed service providers in Q2 2024, down from 24.6% in Q1, in ConnectWise's Service Leadership data report (ConnectWise, 2024).
Sources: IDC (2018, 2021, 2025); Network World; Uptime Institute (2020, 2026); Data Center Knowledge; Microsoft (2014, 2022, 2024); Alphabet; Meta Platforms; Amazon; TechRadar; TechTarget; Professional Advantage; Forrester Consulting (2025); Lenovo; Principled Technologies; PR.com; eWeek; Symantec; Datto; Kaseya; ConnectWise (2024, 2025)
Can Windows Server be upgraded in place, or does it need a migration?
Windows Server 2012 upgrades in place only to 2012 R2 or 2016, so reaching 2025 takes two upgrades or a migration (Microsoft, 2026).

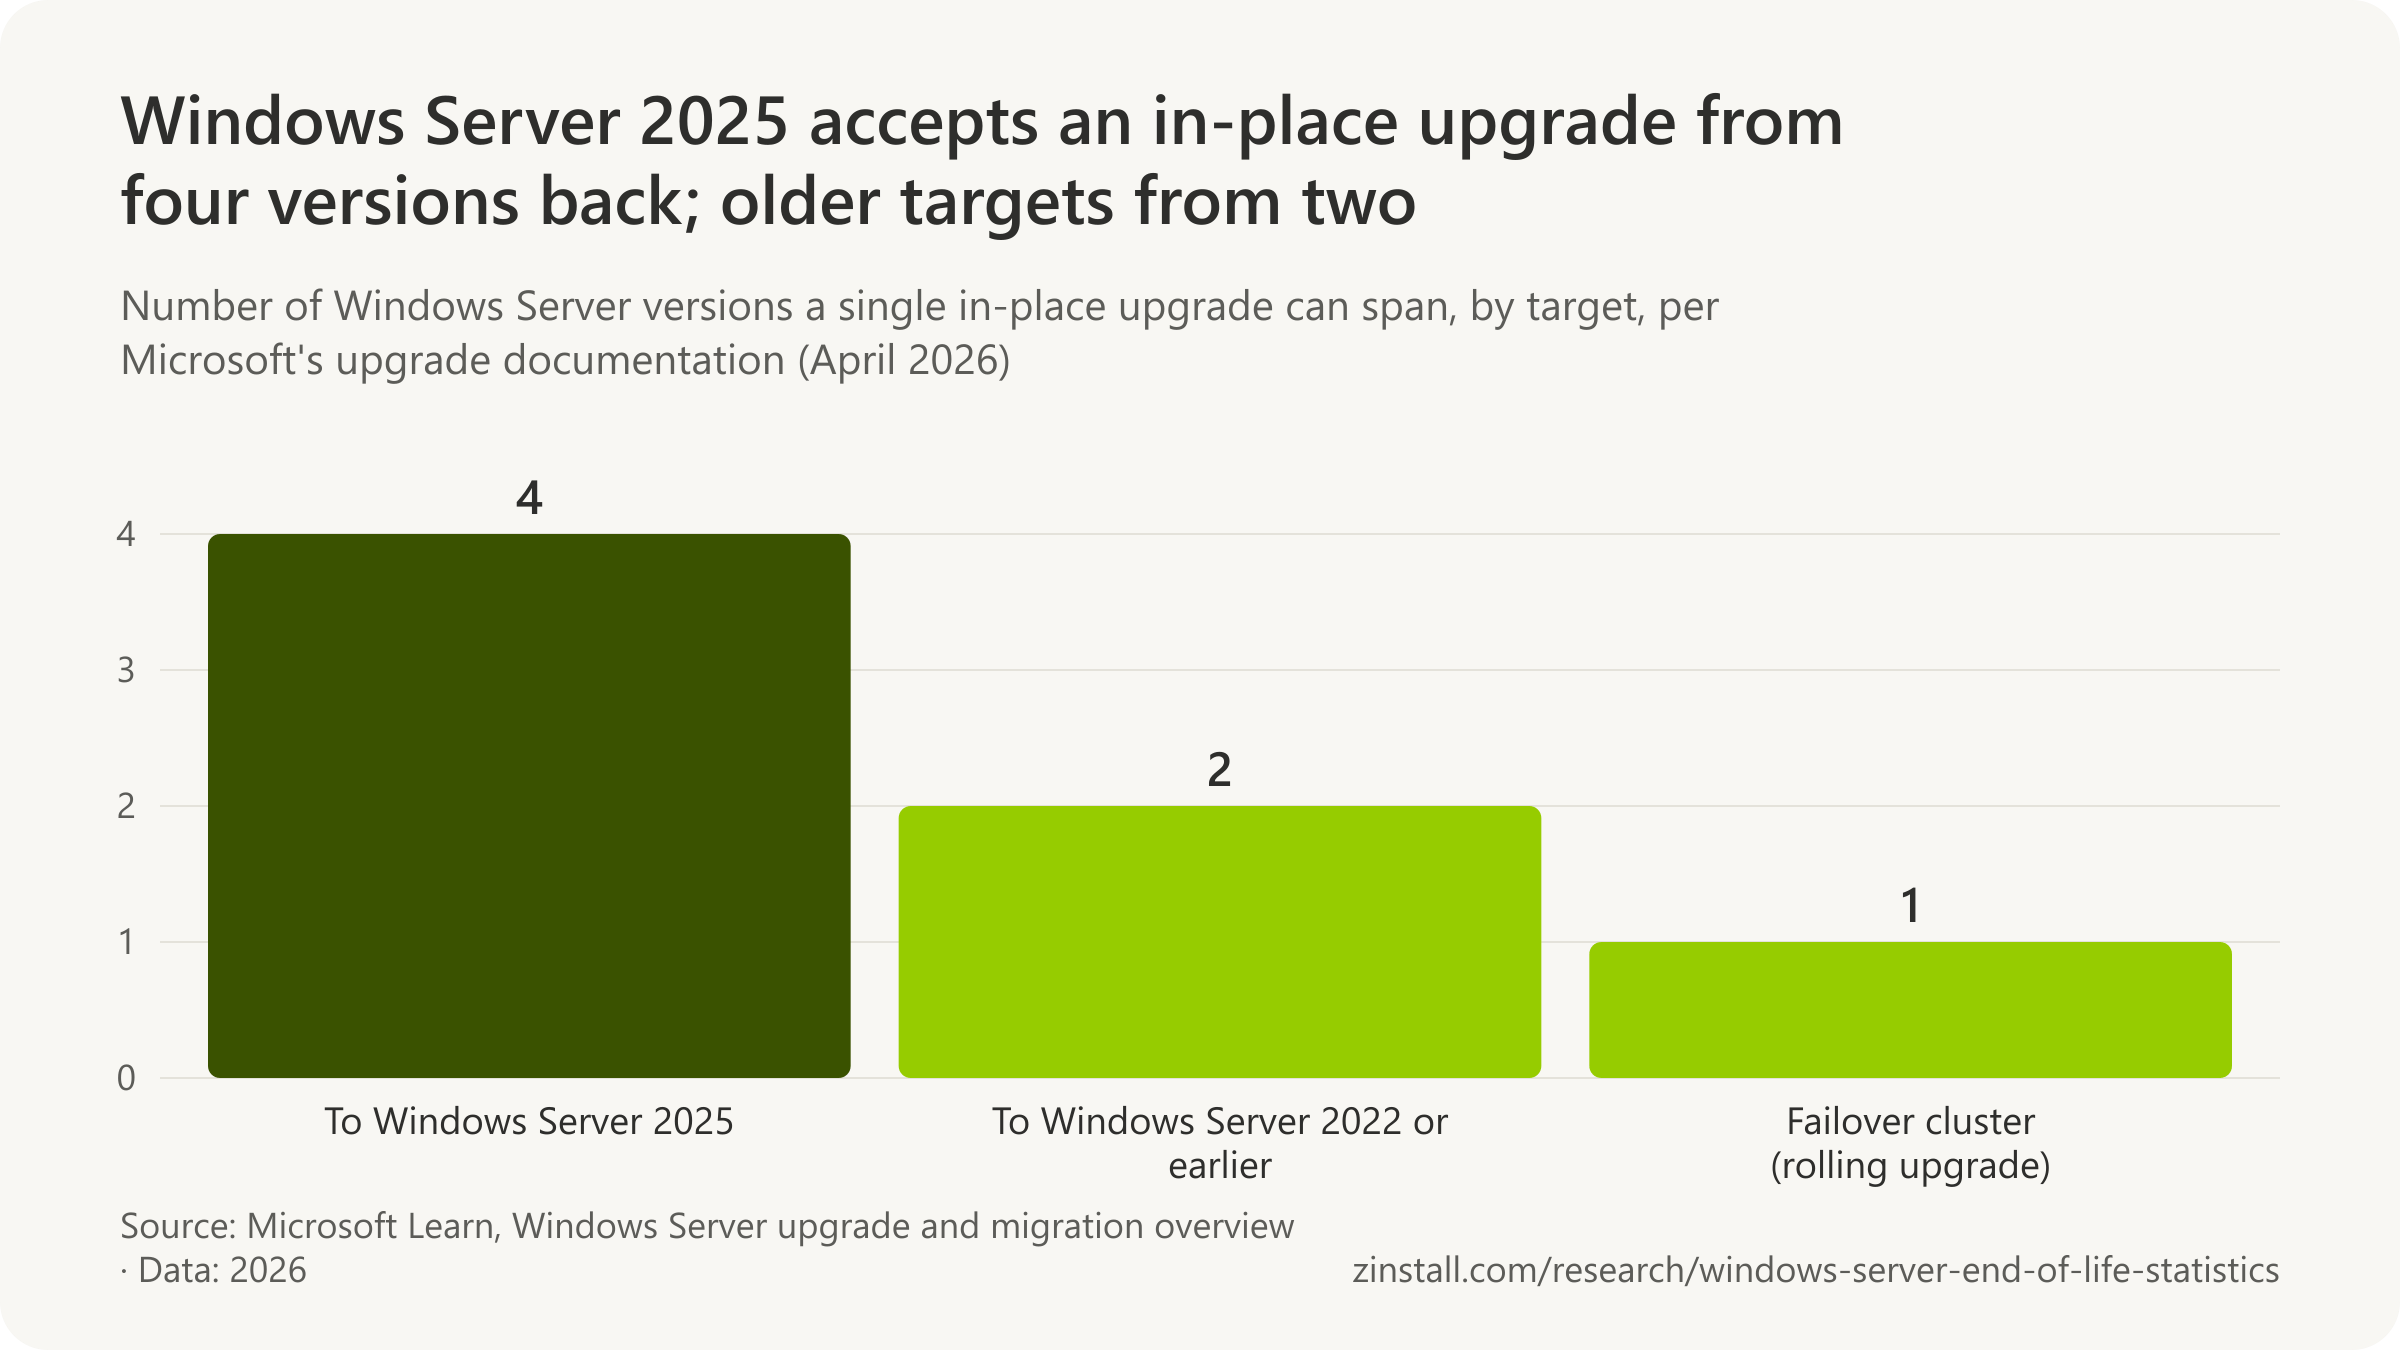
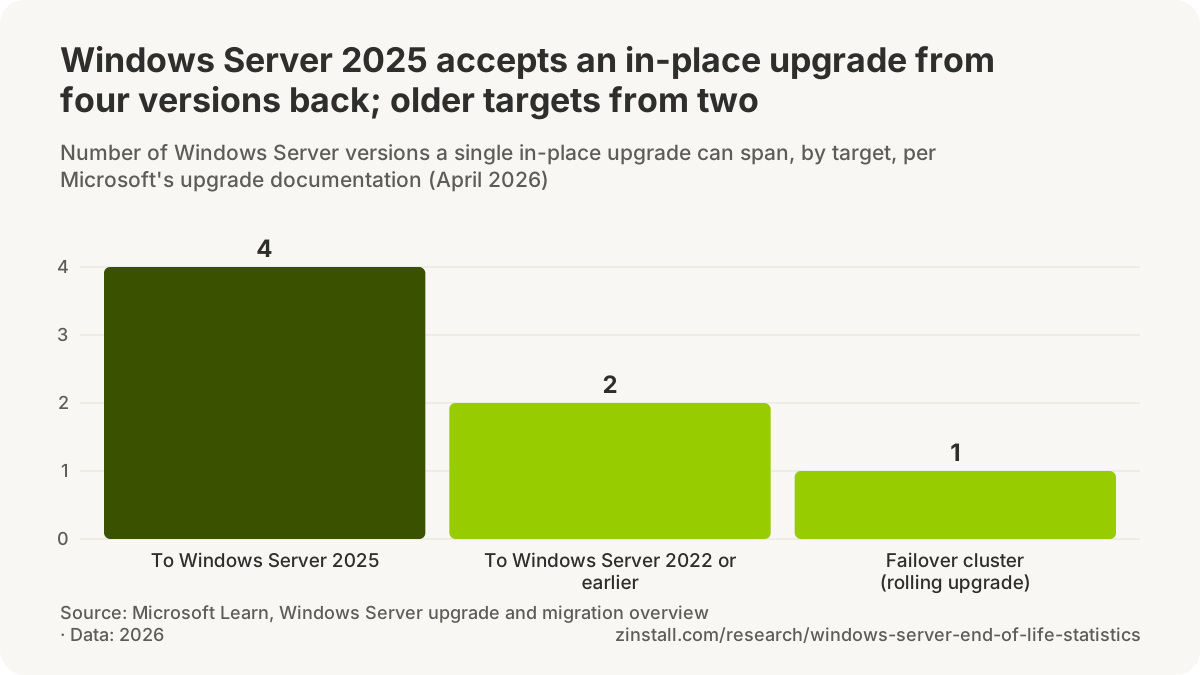
- 10 of 16 server roles, including DNS and IIS, cannot move to a new server without downtime, Microsoft says.
- Microsoft estimates an in-place upgrade to Windows Server 2025 at under an hour per server, though it may take several hours.
- Azure Hybrid Benefit lets the same licences run on-premises and in Azure for 180 days during a move.
- AWS ended support for its Windows Server end-of-support migration tool on 30 April 2025.
- Microsoft's Storage Migration Service accepts 23 source releases, back to Windows Server 2003.
| Rule | Versions or paths |
|---|---|
| To Windows Server 2025: versions back it accepts | 4 versions |
| To Windows Server 2022 or earlier: versions back | 2 versions |
| Failover cluster, rolling upgrade: versions at a time | 1 version |
| From Windows Server 2012 R2: targets | 3 targets (2016, 2019, 2025) |
| Through Windows Update to 2025: versions | 2 versions (2019, 2022) |
| Across languages or from 32-bit to 64-bit: paths | 0 |
| Edition changes allowed | Standard to Datacenter only |
Sources: Microsoft (2024, 2025, 2026); Amazon Web Services
More statistics (26)
0 supported in-place upgrade paths lead from Windows Server 2012 (non-R2) to Windows Server 2019, 2022 or 2025; its only in-place targets are 2012 R2 and 2016, so reaching a current version needs two upgrades or a migration (Microsoft, 2026).
Microsoft supports an in-place upgrade only across a limited number of versions, and only within the same language and architecture. The limits below are from Microsoft's documentation; what follows is what Microsoft says a migration involves and what the cloud providers offer to those who move.
| Rule | Versions or paths |
|---|---|
| To Windows Server 2025: versions back it accepts | 4 versions |
| To Windows Server 2022 or earlier: versions back | 2 versions |
| Failover cluster, rolling upgrade: versions at a time | 1 version |
| From Windows Server 2012: paths to 2019, 2022 or 2025 | 0 of 3 |
| From Windows Server 2012 R2: targets | 3 targets (2016, 2019, 2025) |
| Through Windows Update to 2025: versions | 2 versions (2019, 2022) |
| Across languages or from 32-bit to 64-bit: paths | 0 |
| Edition changes allowed | Standard to Datacenter only |
- Microsoft announced on 5 May 2026 that Windows Server 2019 and 2022 can be upgraded in place to Windows Server 2025 through Windows Update without installation media, eighteen months after Windows Server 2025's release (Microsoft, 2026).
- 10 of the 16 server roles in Microsoft's upgrade and migration matrix, including DNS, IIS, file services and Remote Desktop Services, cannot be migrated to a new Windows Server without downtime (Microsoft, 2026).
- 2 of the 16 server roles in Microsoft's upgrade and migration matrix (AD Federation Services and Print and Fax Services) cannot be upgraded in place, and Microsoft advises against upgrading Active Directory domain controllers in place (Microsoft, 2026).
- Under an hour per server is Microsoft's estimate for a media-based in-place upgrade to Windows Server 2025, though its Windows Server team warns the process may take several hours (Microsoft, 2025).
- About 15 years old is Microsoft's estimate for a physical server still running Windows Server 2012 R2, which it says was probably bought around 2010 or 2011, in its September 2025 upgrade guidance (Microsoft, 2025).
- 23 Windows Server releases and editions, back to Windows Server 2003 and Small Business Server 2003 R2, are supported sources for Microsoft's Storage Migration Service, which needs an orchestrator running Windows Server 2019 or later (Microsoft, 2024).
- $0 is Microsoft's charge for Azure Migrate, its service for discovering, assessing and migrating on-premises servers to Azure, though partner tools used through it may charge (Microsoft, 2026).
- 35,000 servers is the most a single Azure Migrate project can discover and assess for migration to Azure, per Microsoft's planning limits updated February 2025 (Microsoft, 2025).
- Effectively no server installs were in-place upgrades in Microsoft's own customer research, Microsoft engineer Raymond Chen wrote in November 2005: administrators 'always do a clean install' and reinstall their applications (Microsoft, 2005).
What the cloud providers offer to those who move
- Up to 80% off the standard pay-as-you-go rate for Windows Server virtual machines is Microsoft's claim for combining Azure Hybrid Benefit with Azure Reserved VM Instances (Microsoft, 2026).
- 36% average saving against the leading cloud provider is Microsoft's claim for moving a Windows Server estate to Azure with Azure Hybrid Benefit, from its own comparison with equivalent AWS virtual machines at September 2024 prices (Microsoft, 2026).
- 180 days of migration allowance let Windows Server customers use the same licences on-premises and in Azure at once while they move servers, under Microsoft's Azure Hybrid Benefit terms (Microsoft, 2026).
- AWS launched its End-of-Support Migration Program for Windows Server on 1 December 2019, six weeks before Windows Server 2008's end of support, to repackage applications from Windows Server 2003, 2008 and 2008 R2 for newer versions without code changes (AWS, 2019).
- AWS ended support for its End-of-Support Migration Program (EMP) tool for Windows Server on 30 April 2025, five years and five months after its December 2019 launch, and the programme page now redirects to the AWS home page (AWS, 2025).
- 77% savings on Windows Server licence costs and 45% on SQL Server is what AWS claims customers achieve through its Optimization and Licensing Assessment, on its Windows page in October 2026 (AWS, 2026).
- 9 Compute Engine machine families (E2, N1, N2, N2D, T2D, C2, C2D, M1 and M2) would keep running Windows Server 2012 after its October 2023 end of support, Google Cloud said, offering ESU support and commercial help to win those workloads (Google Cloud, 2023).
- $0 additional cost is what Microsoft announced at Ignite 2024 for Azure Update Manager, Azure Policy guest configuration, change tracking and other Azure management tools on Windows Server 2016, 2019, 2022 and 2025 for Software Assurance or subscription customers (Microsoft, 2024).
- Azure Local, Microsoft's Azure Arc-enabled hybrid infrastructure platform that replaced Azure Stack HCI and the Azure Stack family, became generally available at Ignite on 19 November 2024 (Microsoft, 2024).
Sources: Microsoft (2005-2026); Amazon Web Services (2019, 2025, 2026); Google Cloud
What happens when Windows Server 2016 reaches end of life in 2027?

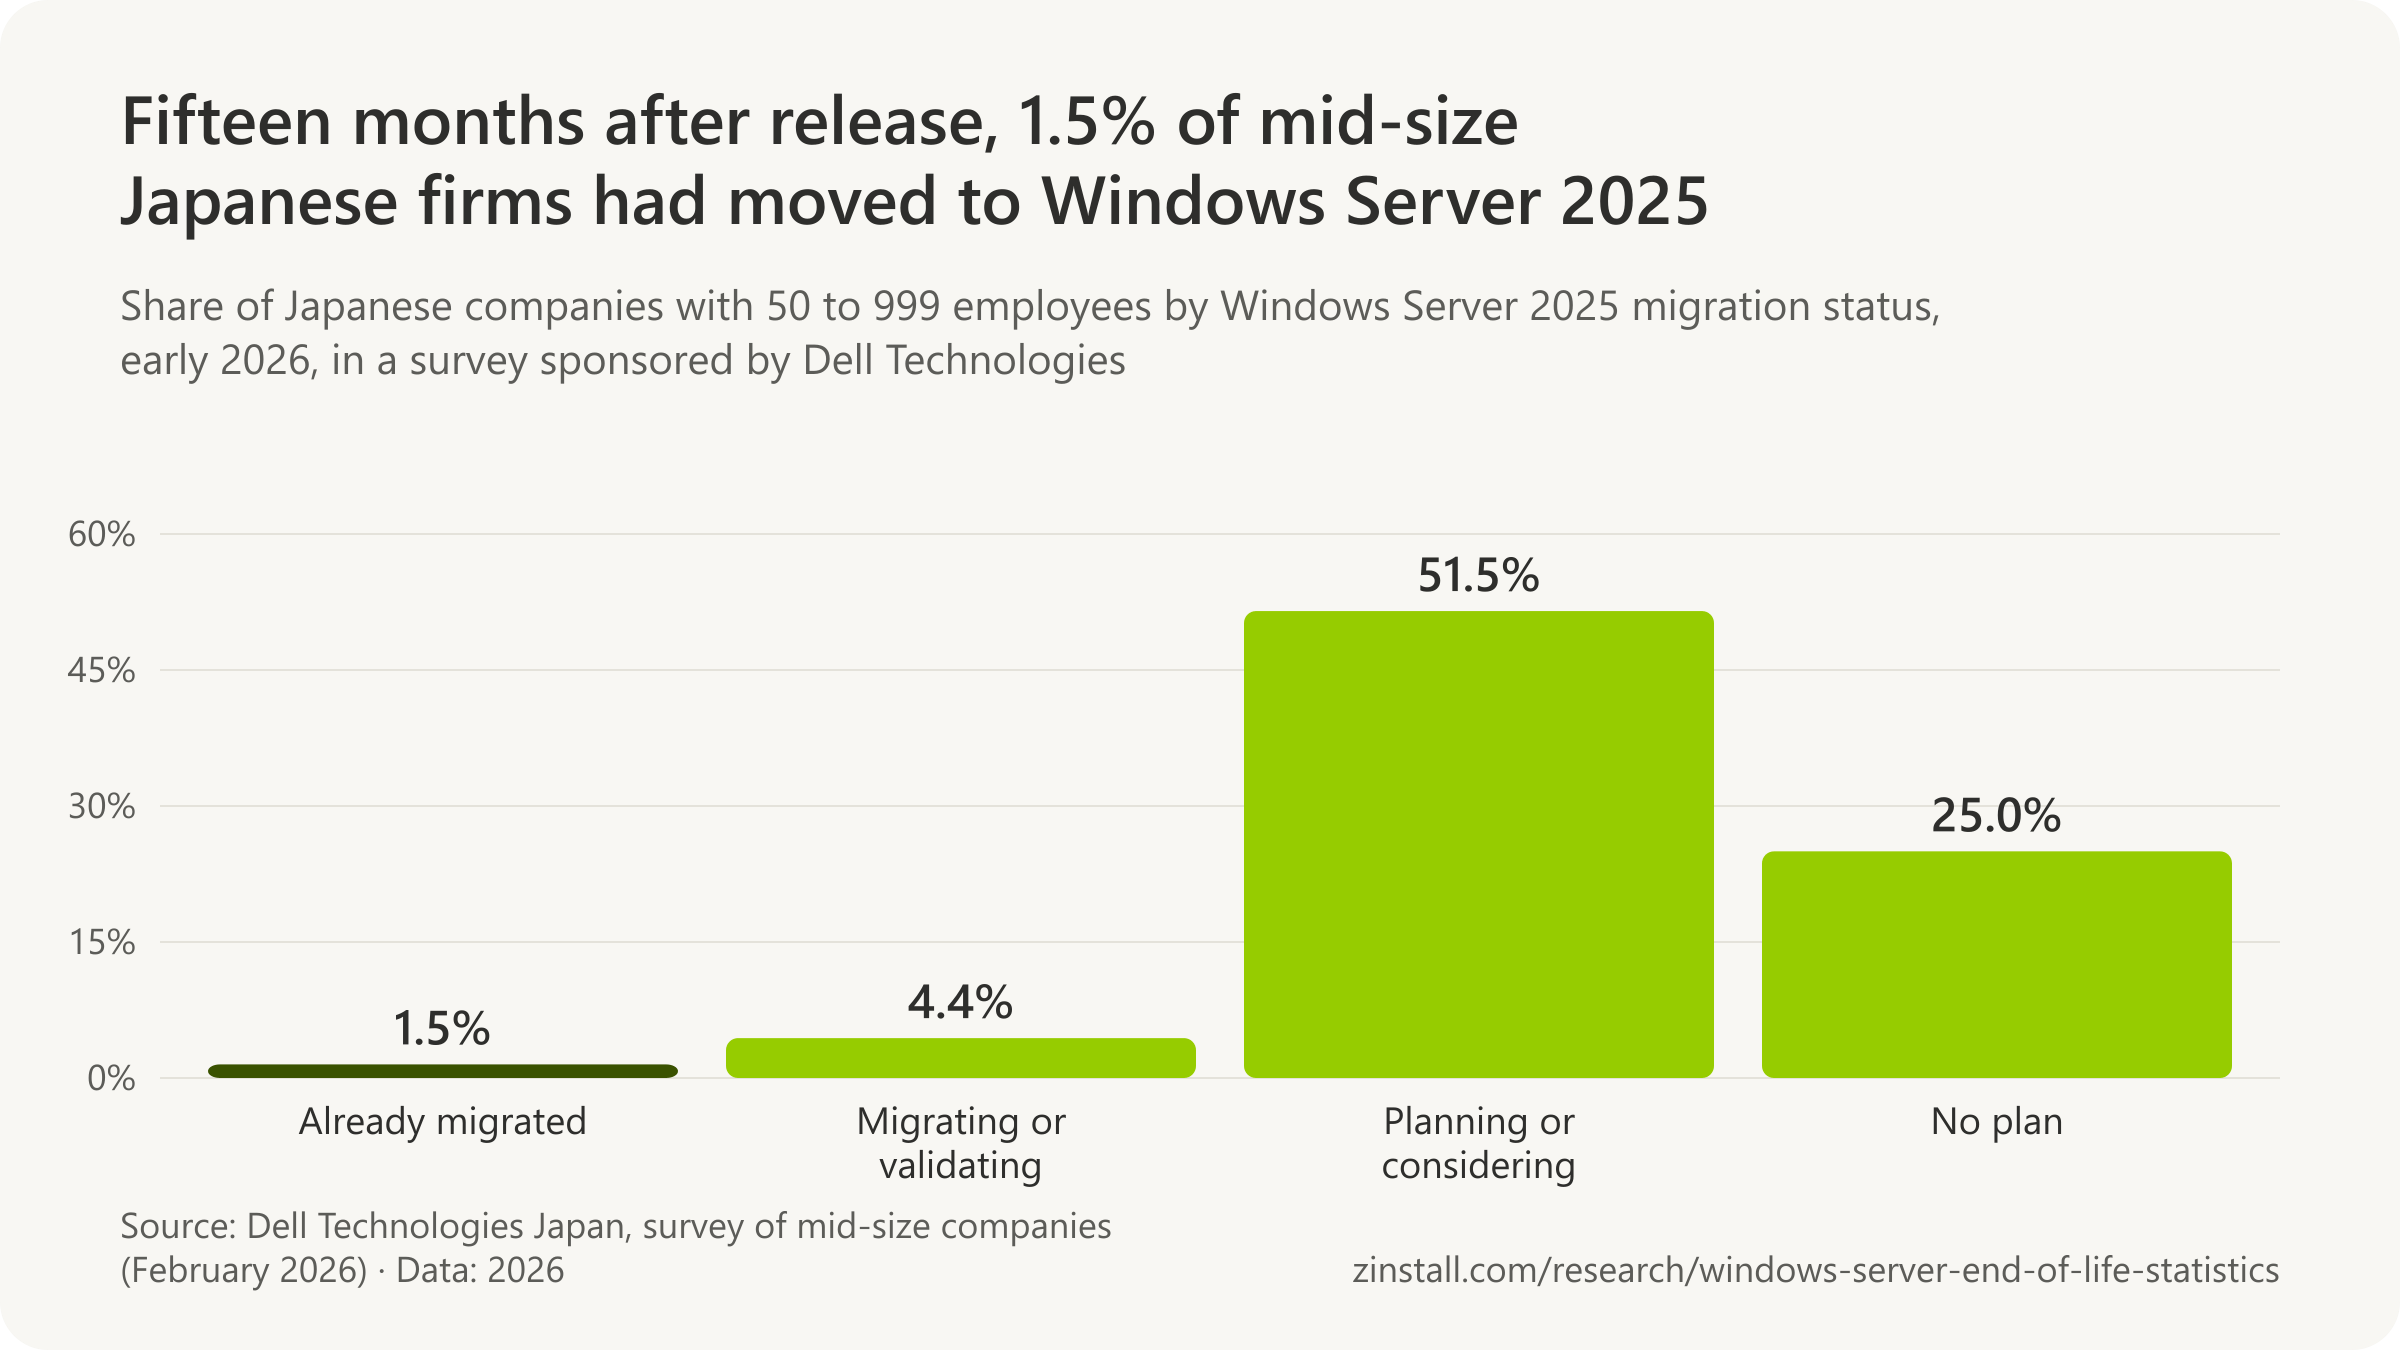
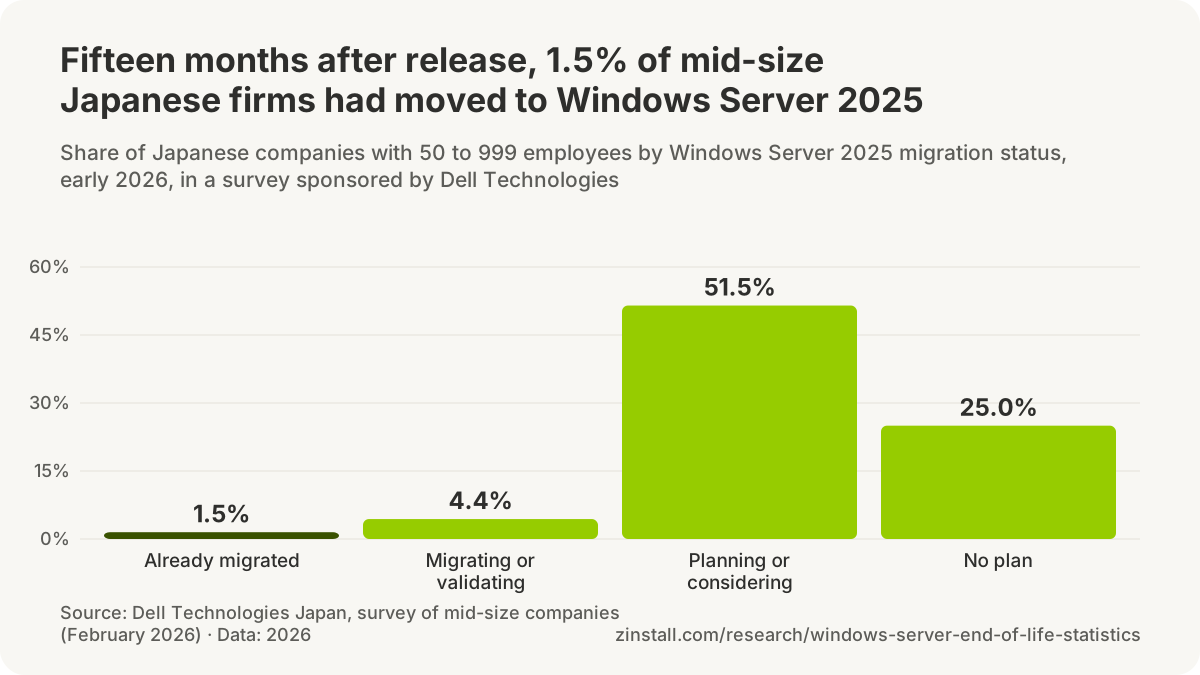
- About 250,000 Windows Server 2016 systems were still running in Japan in November 2025.
- 43.1% of Japanese firms with 50 to 999 staff still used Windows Server 2016 in early 2026, in a Dell-sponsored survey.
- Only 1.5% of Japanese firms with 50 to 999 employees had moved to Windows Server 2025 in early 2026, fifteen months after its release.
- 72.9% of 70 UK public bodies that named their server versions listed Windows Server 2016, in 2024-25 Freedom of Information answers.
- Azure Arc, the route to paid updates, had 39,000 customers in September 2024, the last count Microsoft gave.
| Date, outlet and wording | Figure as stated |
|---|---|
| 2 March 2026, The Register: 'more than a fifth of servers' (Lansweeper's monitored servers) | more than a fifth (20.3%) |
| 7 May 2026, Air IT: 'around one in five', called independent analysis | around one in five |
| 16 July 2026, Servnet: 'one in five (20.3%)' of the servers Lansweeper monitors | one in five (20.3%) |
| 18 August 2026, Jimber: 'roughly one in five enterprise servers', no source | roughly one in five |
Sources: The Register (2026a, 2026b); MM Research Institute; Dell Technologies Japan; Servnet Research (2026a, 2026b); Microsoft; Air IT Group; Jimber
More statistics (40)
20.3% of all the servers Lansweeper monitors were running Windows Server 2016 in March 2026, ten months before its 12 January 2027 end of extended support (Lansweeper data via The Register, 2026).
The next deadline is Windows Server 2016 in January 2027, then Windows Server 2019 in 2029. Windows Server 2022 has entered extended support and Windows Server 2025 is the current release; the figures below are what has been published about who still runs the older versions and who has moved to the newest.
| Survey, date and measure | Figure | Scope |
|---|---|---|
| MM Research Institute, late 2025: non-virtualised servers on Windows Server 2016 | 13.8% | Japanese companies' IT department staff (screening survey, 45,172 valid responses) · Japan · 2025-10 to 2025-12 |
| MM Research Institute: Windows Server as host and guest OS on virtualised servers | 75.3% (hosts), 78.5% (guests) | Japanese companies' virtualised servers (MM Research survey) · Japan · 2025-10 to 2025-12 |
| MM Research Institute: Windows Server 2016 among virtualised Windows Server | about 20% | Japanese companies' virtualised servers running Windows Server · Japan · 2025-10 to 2025-12 |
| MM Research Institute, November 2025: Windows Server 2016 systems in operation | about 250,000 | Windows Server 2016 systems in Japan, including virtual servers · Japan · 2025-11 |
| MM Research Institute: users investigating, migrating, with no plan | 57% investigating, 17% migrating, 10% no plan | Japanese companies using Windows Server 2016 (MM Research '国内サーバー稼働状況実態調査') · Japan · 2025-12 |
| MM Research Institute: not migrated because of staff shortage | 45% | Japanese companies using Windows Server 2016 that had not migrated · Japan · 2025-10 to 2025-12 |
| MM Research Institute: Windows Server 2016 used as a web server | 54.2% | Japanese companies using Windows Server 2016 · Japan · 2025-10 to 2025-12 |
| MM Research Institute: aware support is ending; unsure of the month | over 80% aware; 70% unsure of the date | Japanese companies using Windows Server 2016 (main survey) · Japan · 2025-10 to 2025-12 |
| MM Research Institute: naming the cloud as destination | about 5% | Japanese companies using Windows Server 2016 (main survey, 967 valid responses) · Japan · 2025-10 to 2025-12 |
| Dell-sponsored survey, early 2026: firms of 50 to 999 staff still using Windows Server 2016 | 43.1% | Japanese companies with 50 to 999 employees (Dell Technologies-sponsored survey; sample size not stated) · Japan · 2026-02 |
| Dell-sponsored survey: using Windows Server 2019 | 63.2% | Japanese companies with 50 to 999 employees (Dell Technologies-sponsored survey; sample size not stated) · Japan · 2026-02 |
| Dell-sponsored survey: already on Windows Server 2025 | 1.5% | Japanese companies with 50 to 999 employees (Dell Technologies-sponsored survey; sample size not stated) · Japan · 2026-02 |
| Dell-sponsored survey: migrating to or validating Windows Server 2025 | 4.4% | Japanese companies with 50 to 999 employees (Dell Technologies-sponsored survey; sample size not stated) · Japan · 2026-02 |
| Dell-sponsored survey: planning or considering; no plan | 51.5% planning or considering; 25.0% no plan | Japanese companies with 50 to 999 employees (Dell Technologies-sponsored survey; sample size not stated) · Japan · 2026-02 |
| Dell-sponsored survey: hotpatching the most anticipated feature | 51.5% | Japanese companies with 50 to 999 employees (Dell Technologies-sponsored survey; sample size not stated) · Japan · 2026-02 |
| Answers and release | Share of bodies | Scope |
|---|---|---|
| 2024-25, 70 bodies: Windows Server 2016 | 72.9% (51 of 70) | UK public bodies that named at least one Windows Server release in FOI answers (70 of 223 asked) · United Kingdom (public bodies answering FOI requests) · 2024-11 to 2025-07 |
| 2024-25: Windows Server 2019; 2022 | 81.4% (2019), 58.6% (2022) | UK public bodies that named at least one Windows Server release in FOI answers · United Kingdom (public bodies answering FOI requests) · 2024-11 to 2025-07 |
| 2024-25: Windows Server 2012 R2 or older | 21.4% (15 of 70) | UK public bodies that named at least one Windows Server release in FOI answers · United Kingdom (public bodies answering FOI requests) · 2024-11 to 2025-07 |
| 2024-25: Windows Server 2025 | fewer than 5 of 70 | UK public bodies that named at least one Windows Server release in FOI answers · United Kingdom (public bodies answering FOI requests) · 2024-11 to 2025-07 |
| 2023-24, 21 bodies: Windows Server 2016 | 61.9% (13 of 21) | UK public bodies that named at least one Windows Server release in 2023-24 FOI answers (21 of 84 asked) · United Kingdom (public bodies answering FOI requests) · 2023-08 to 2024-01 |
- 0 adoption figures for Windows Server 2025 accompanied Microsoft's February 2026 statement that 'many customers are already upgrading to the latest version of Windows Server' (Microsoft, 2026).
- Azure Arc-enabled Extended Security Updates for Windows Server 2016 were reported as generally available on 6 August 2026 by Redmond Magazine, three days after Microsoft's 3 August portal enrolment date (Redmondmag.com, 2026).
- 60% more storage IOPS is the maximum gain Microsoft claims for Windows Server 2025 over Windows Server 2022 on identical NVMe systems, in a 4K random-read test (Microsoft, 2024).
- More than half of SMBs were 'still considering' a move to Windows Server 2025, Techzine wrote in September 2026, restating the Dell-sponsored Japanese survey's 51.5% 'planning or considering' figure without naming the surveyor or the country (Techzine, 2026).

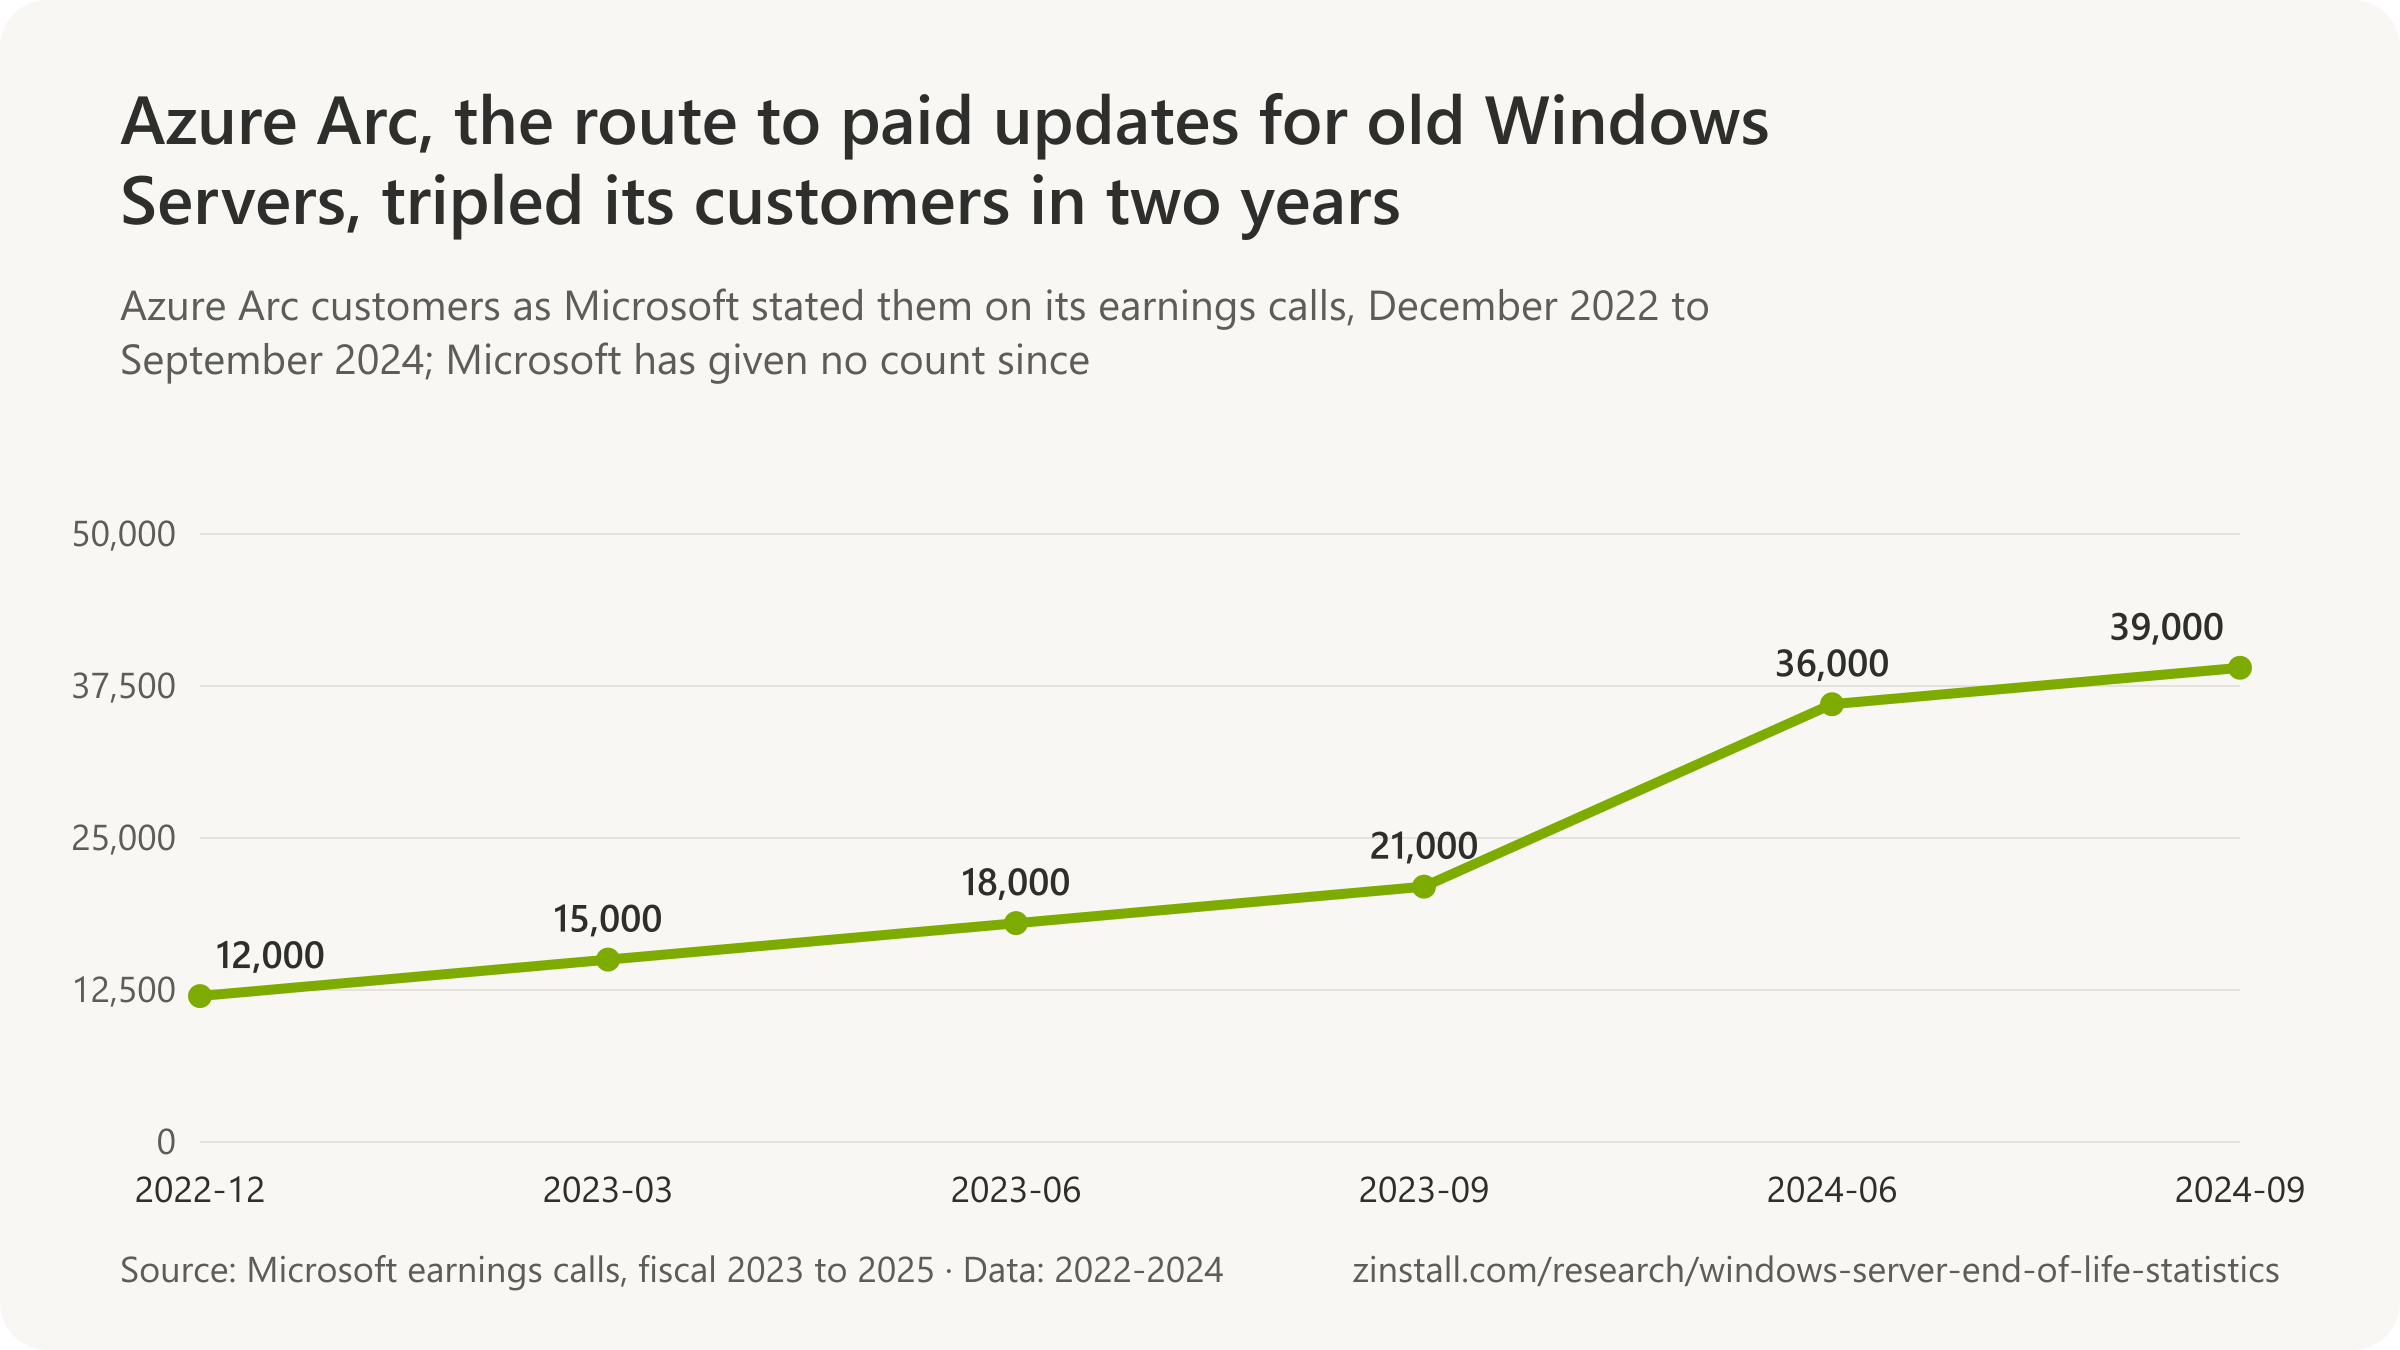
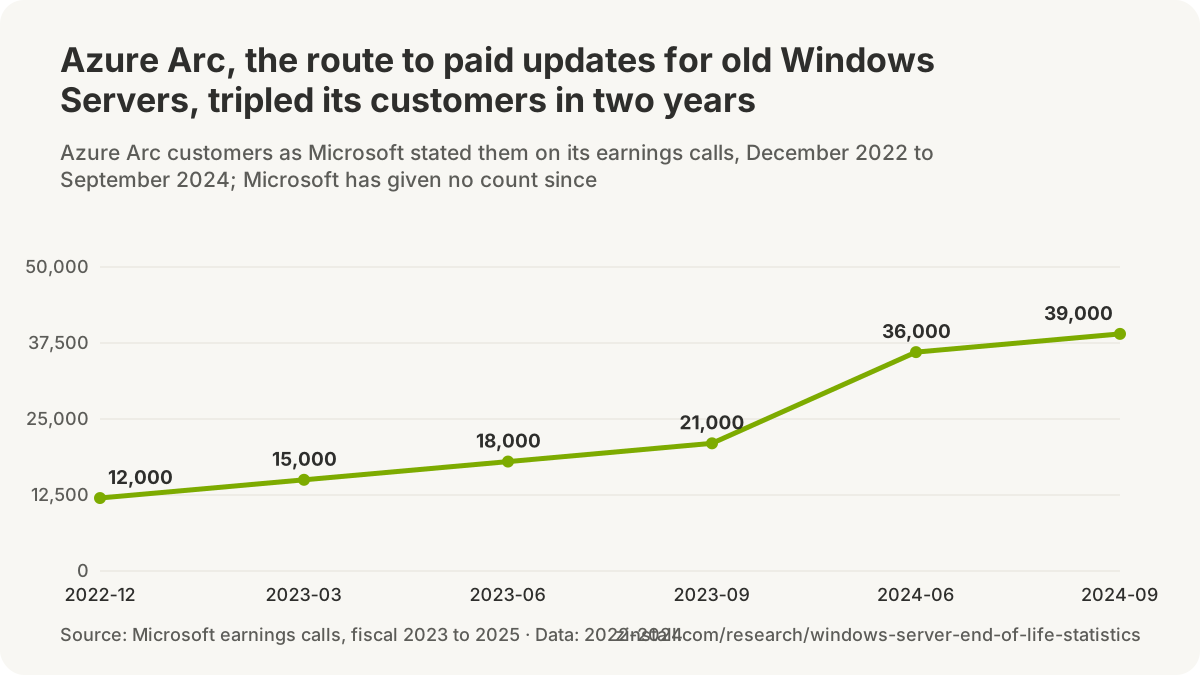
| Quarter end | Customers | Scope |
|---|---|---|
| December 2022 | 12,000+ | Organisations using Azure Arc (Microsoft's hybrid management service for non-Azure servers) · Worldwide · 2022-12 |
| March 2023 | 15,000+ | Organisations using Azure Arc · Worldwide · 2023-03 |
| June 2023 | 18,000 | Organisations using Azure Arc · Worldwide · 2023-06 |
| September 2023 | 21,000 | Organisations using Azure Arc · Worldwide · 2023-09 |
| June 2024 | 36,000 | Organisations using Azure Arc (Microsoft's hybrid management service for non-Azure servers) · Worldwide · 2024-06 |
| September 2024 | 39,000+ | Organisations using Azure Arc · Worldwide · 2024-09 |
- 0 Azure Arc customer counts were given in Microsoft's seven earnings-call transcripts from January 2025 to July 2026, so the 39,000 given in October 2024, for September 2024, remains the latest published figure (Microsoft, 2026).
One in five, as it travelled
| Date, outlet and wording | Figure as stated | Scope |
|---|---|---|
| 2 March 2026, The Register: 'more than a fifth of servers' (Lansweeper's monitored servers) | more than a fifth (20.3%) | Servers monitored by Lansweeper at its customers (count not stated) · Worldwide (Lansweeper customer base) · 2026-03 |
| 7 May 2026, Air IT: 'around one in five', called independent analysis | around one in five | 'servers in monitored environments' (Lansweeper's customer servers, unnamed) · Worldwide (as implied) · 2026-05 |
| 16 July 2026, Servnet: 'one in five (20.3%)' of the servers Lansweeper monitors | one in five (20.3%) | Servers monitored by Lansweeper (as restated) · Worldwide (Lansweeper customer base) · 2026-07 |
| 18 August 2026, Jimber: 'roughly one in five enterprise servers', no source | roughly one in five | 'enterprise servers' (unspecified) · Worldwide (as implied) · 2026-08 |
- A Lansweeper audit of 1.3 million Windows Server installations found 20.94% still on Server 2012/R2 'long past its end of life', Jimber wrote in August 2026, although Lansweeper's September 2023 audit predates that end of support by five weeks (Jimber, 2026).
- 'As of April 2017, 35% of servers were running Windows Server 2012, surpassing usage share of Windows Server 2008', says Wikipedia's Windows Server 2012 article, citing a Smart Profile paper that measured 34% of Dutch business sites with 50 or more employees (Wikipedia, 2026).
- 'A Spiceworks survey found that 68% of enterprises plan to prioritize Azure migration' over paying for Windows Server 2016 ESU, WPS Office's blog said in June 2026, naming no survey, date or link (WPS Office, 2026).
Sources: The Register (2026); MM Research Institute (2025, 2026); Dell Technologies Japan; Servnet Research (2026); Microsoft (2023, 2024, 2026); Redmond Magazine; Techzine (2023, 2026); Air IT Group; Jimber; Wikipedia; WPS Office
Data. All 596 statistics on this page, each with its source, verbatim quote and locator: CSV · JSON. Charts and figures on this page may be reused with a link to https://www.zinstall.com/research/windows-server-end-of-life-statistics as the source. Original publishers retain attribution.
Data behind each chart (CSV, 21 files)
- Each Windows Server release gets about ten years of support before any paid extension
- About one Windows Server in five was still on the outgoing version around each deadline
- In 2016 Windows Server 2008 ran almost half of the servers Spiceworks could see
- Four months after its end of support, 59% of organisations still ran Windows Server 2003
- Internet scanners still see Windows Server 2012 more than any other version
- A quarter of the Windows Server 2012 systems scanners see on the internet are in the United States
- Windows Server 2012 R2 kept collecting 400 or more vulnerabilities a year after its support ended
- Newer Windows Server versions are listed in more vulnerabilities each year, not fewer
- Windows Server 2016 security updates cost $5.21 per core a month through Azure Arc, 10% more than 2012's
- More than half of organisations still ran Windows Server 2003 a year after its support ended
- Enterprise-owned data centres fell from two thirds to under half of enterprise workloads
- Half of enterprise workloads still run outside the public cloud
- Servers' share of business hardware budgets fell from a fifth to about an eighth
- Microsoft's on-premises server revenue grew around Windows Server 2012's end of support, then shrank
- Windows runs one website in twelve, down from one in three a decade ago
- Windows' and IIS's shares of websites have fallen every year since 2018
- An ageing server costs nearly three times as much a year to run, IDC found
- The largest cloud operators now book their servers for five to six years
- Windows Server 2025 accepts an in-place upgrade from four versions back; older targets from two
- Fifteen months after release, 1.5% of mid-size Japanese firms had moved to Windows Server 2025
- Azure Arc, the route to paid updates for old Windows Servers, tripled its customers in two years
Methodology
What we included. This page collects every Windows Server, Hyper-V Server, SQL Server and Exchange Server lifecycle date from Microsoft's lifecycle pages; Microsoft's Extended Security Updates terms and prices (lifecycle FAQ, the ESU documentation, the Azure Retail Prices API); the install-base audits and surveys we could trace to their publisher (Lansweeper, Spiceworks, Softchoice, CloudPhysics, Bitsight, Smart Profile, MM Research Institute, a Dell-sponsored survey in Japan, Servnet's Freedom of Information requests, W3Techs, Netcraft, IDC); the exposure figures (counts we made from Microsoft's monthly security documents and CISA's Known Exploited Vulnerabilities catalogue, Shadowserver, Rapid7, Shodan, Cybernews, Bitsight, Microsoft's security reports, regulators' penalty notices, agency guidance); the on-premises and cloud surveys (Spiceworks, Uptime Institute, Flexera, TechRepublic Premium, Kaspersky, IDC, Gartner, Synergy); the cost and effort figures (IDC, Uptime Institute, Omdia, the cloud operators' annual reports, Forrester and IDC studies commissioned by vendors and labelled as such, Microsoft's upgrade documentation, the cloud providers' own claims); the previous deadlines (Microsoft, HP, Dell, Gartner, Spiceworks, Rapid7 and the trade press of 2014 to 2020); and the restatements in circulation, each with what it traces to. Official statistics, the trackers' own publications, company filings and transcripts, and peer-reviewed or analyst reports are preferred; vendor surveys and news reports are included only where no better source exists and are labelled as such in the dataset.
How each figure was verified. Every record carries the exact sentence or table cell from the source (the quote) and where it sits (the locator). A researcher confirmed each one against the source document; a script then re-fetched every source on October 14, 2026 and checked for the quote. Records the script could not confirm are kept only if the researcher's check was complete, and are marked for human review in the dataset. Restatements (a later outlet quoting an earlier figure) are recorded as restatements, with the primary figure alongside.
What we excluded. Dates from aggregator sites (recorded only where they differ from Microsoft); counts of companies 'using' a version from data vendors that publish no method, as findings; the '24 million' Windows Server 2003 instances as a Microsoft figure; the 'one in five servers on Windows Server 2016' as a figure about all servers; TechRepublic's 2021 on-premises share, which could not be traced; any first-party Zinstall data; and any average computed across audits with different populations. Where a source gives a figure only in a form we could not confirm (for example, a chart with no data table), the record is marked unverified and is not exported.
Rounding and derivation. Numbers are reproduced as published. Where a tracker publishes two decimals, statements and table cells give one decimal, rounded half up, and the dataset keeps the published value. In the short sentences at the top of the page and of each section, large counts and money amounts may be rounded to two or three significant figures; the exact figure follows in the section's full statements and in the dataset. Derived figures (a change between two months, a share computed from two counts) say so and name their inputs. The bold figure in each statement is a reading aid, not an edit.
Updates. Sources are re-checked and new figures added quarterly, with the monthly tracker series topped up as they are published; the next scheduled refresh is January 2027 (after Windows Server 2016's end of support), then quarterly. Corrections are welcome through the contact page.
Counts made for this page. Vulnerability counts per year were computed on 14 October 2026 from Microsoft's monthly security update documents (the CVRF API), counting distinct CVE identifiers whose known-affected products include the named Windows Server version; the API no longer serves November 2025, so 2025 counts are lower bounds. Counts from CISA's Known Exploited Vulnerabilities catalogue (version 2026.10.13) were joined with Microsoft's advisories to find the entries that affect each version. Both count published vulnerabilities, not attacks.
Cite this page
Zinstall. "Statistics on Windows Server Versions in Use, End-of-Life Dates, and What Happens Next." https://www.zinstall.com/research/windows-server-end-of-life-statistics. Updated 2026-10-14.
Frequently asked questions
When does Windows Server 2016 reach end of life?
Windows Server 2016 reaches the end of extended support on 12 January 2027, after mainstream support ended on 11 January 2022. Microsoft announced in February 2026 that it will sell Extended Security Updates for it through Azure Arc for up to three years, through 2030, with billing from 13 January 2027.
When did Windows Server 2012 R2 reach end of life, and when did its Extended Security Updates end?
Windows Server 2012 and 2012 R2 reached the end of extended support on 10 October 2023. Paid Extended Security Updates ran for three more years and ended on 13 October 2026; licences bought through Azure Arc were deactivated at midnight UTC the next day. There is no fourth year.
How many servers still run Windows Server 2012?
No one counts every server. In Lansweeper's inventories, about a fifth of 1.3 million Windows Server instances still ran Windows Server 2012 or 2012 R2 five weeks before its October 2023 end of support. Bitsight's internet scanner showed 920,444 observations of Windows Server 2012 the day after its paid updates ended, a quarter of them in the United States; that is a count of what answers on the internet, not of servers in use.
How much do Windows Server Extended Security Updates cost?
For Windows Server 2016, sold only through Azure Arc, the list price is $5.21 per core per month for Standard and $29.98 for Datacenter, about $2,999 over three years for a minimum 16-core Standard server. Windows Server 2012 updates bought on-premises cost the full licence price each year, and were free for servers running in Azure.
What are the end-of-life dates for Windows Server 2019, 2022 and 2025?
Windows Server 2019 reaches the end of extended support on 9 January 2029. Windows Server 2022 left mainstream support on 13 October 2026 and reaches the end of extended support on 14 October 2031. Windows Server 2025 has mainstream support to 13 November 2029 and extended support to 14 November 2034.
Can Windows Server 2012 be upgraded in place to Windows Server 2025?
Windows Server 2012 R2 can, because Windows Server 2025 accepts in-place upgrades from up to four versions back. Windows Server 2012 without R2 cannot: its only in-place targets are 2012 R2 and 2016, so it needs two upgrades or a migration. An upgrade cannot change the language or move from 32-bit to 64-bit, and Microsoft lists ten of sixteen server roles that cannot be migrated without downtime.
How many businesses still run on-premises servers?
Most. In Spiceworks' 2019 survey 98% of businesses in North America and Europe ran server hardware on their premises, and in Uptime Institute's 2026 survey 44% of enterprise workloads still ran in enterprise-owned data centres, with third-party venues at 46%. Flexera's 2026 respondents had 54% of enterprise workloads in public cloud, so the rest still ran elsewhere.
Which sources should I cite for Windows Server end-of-life statistics?
For dates, Microsoft's lifecycle page for each version, not an aggregator; five of the twenty-three pages we checked gave a wrong date for Windows Server 2016. For how many servers still run an old version, Lansweeper's audits as reported by Techzine and The Register, with the population named (its customers' servers). For exposure, Microsoft's monthly security documents and CISA's Known Exploited Vulnerabilities catalogue. For the previous deadlines, Spiceworks' network data.
Sources: Microsoft (2023-2026); Techzine; Bitsight; Spiceworks (2016, 2019); Uptime Institute; Flexera; The Register; Cybersecurity and Infrastructure Security Agency
Ready to migrate your server?
Sources
Every source document behind the figures on this page, listed by publisher. The sources line under each section links each publisher to its document, and the dataset carries the verbatim quote and locator for every statistic.
Show all 313 sources
Loading the list of sources. It is also published as a file: JSON.
guarantee Buy now